29
/
en
AIzaSyAYiBZKx7MnpbEhh9jyipgxe19OcubqV5w
April 1, 2024
163457
Japan
JPN
true
2
1
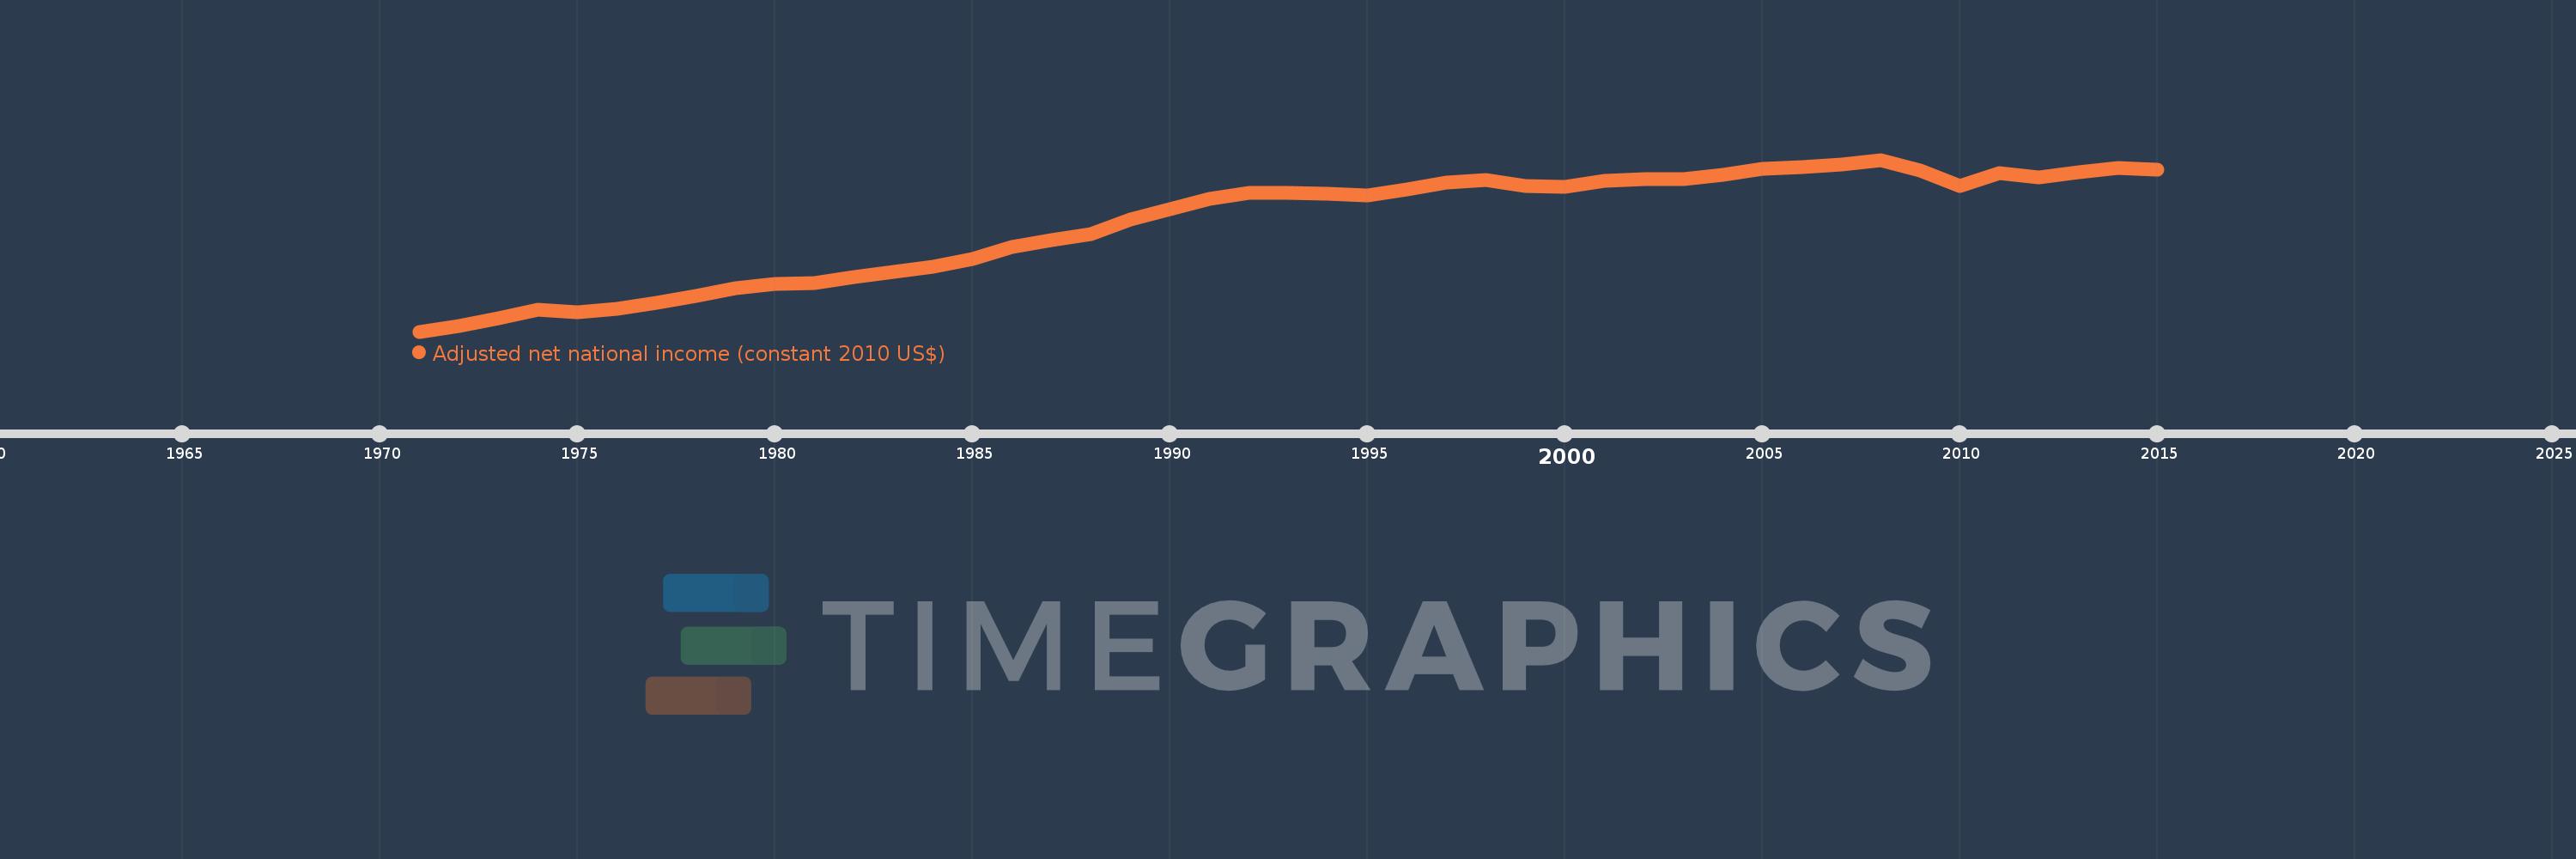
Adjusted net national income (constant 2010 US$)
2015,2014,2013,2012,2011,2010,2009,2008,2007,2006,2005,2004,2003,2002,2001,2000,1999,1998,1997,1996,1995,1994,1993,1992,1991,1990,1989,1988,1987,1986,1985,1984,1983,1982,1981,1980,1979,1978,1977,1976,1975,1974,1973,1972,1971
This statistics in other country:
AfghanistanAlbaniaAlgeriaAngolaArab WorldArgentinaArmeniaAustraliaAustriaAzerbaijanBahamas, TheBahrainBangladeshBarbadosBelarusBelgiumBelizeBeninBhutanBoliviaBotswanaBrazilBulgariaBurkina FasoBurundiCabo VerdeCambodiaCameroonCanadaCaribbean small statesCentral African RepublicCentral Europe and the BalticsChadChileChinaColombiaComorosCongo, Dem. Rep.Congo, Rep.Costa RicaCote d'IvoireCroatiaCubaCyprusCzech RepublicDenmarkDominicaDominican RepublicEarly-demographic dividendEast Asia & PacificEast Asia & Pacific (excluding high income)East Asia & Pacific (IDA & IBRD countries)EcuadorEgypt, Arab Rep.El SalvadorEritreaEstoniaEthiopiaEuro areaEurope & Central AsiaEurope & Central Asia (excluding high income)Europe & Central Asia (IDA & IBRD countries)European UnionFijiFinlandFragile and conflict affected situationsFranceGabonGambia, TheGeorgiaGermanyGhanaGreeceGuatemalaGuineaGuinea-BissauGuyanaHaitiHeavily indebted poor countries (HIPC)High incomeHondurasHungaryIBRD onlyIDA & IBRD totalIDA blendIDA onlyIDA totalIndiaIndonesiaIran, Islamic Rep.IraqIrelandIsraelItalyJamaicaJapanJordanKazakhstanKenyaKiribatiKorea, Rep.KuwaitKyrgyz RepublicLao PDRLate-demographic dividendLatin America & Caribbean Latin America & Caribbean (excluding high income)Latin America & the Caribbean (IDA & IBRD countries)LatviaLeast developed countries: UN classificationLebanonLesothoLiberiaLibyaLithuaniaLow & middle incomeLow incomeLower middle incomeLuxembourgMacedonia, FYRMadagascarMalawiMalaysiaMaldivesMaliMauritaniaMauritiusMexicoMiddle East & North AfricaMiddle East & North Africa (excluding high income)Middle East & North Africa (IDA & IBRD countries)Middle incomeMoldovaMongoliaMoroccoMozambiqueNamibiaNepalNetherlandsNew ZealandNicaraguaNigerNigeriaNorth AmericaNorwayOECD membersOmanOther small statesPacific island small statesPakistanPanamaPapua New GuineaParaguayPeruPhilippinesPolandPortugalPost-demographic dividendPre-demographic dividendQatarRomaniaRussian FederationRwandaSamoaSao Tome and PrincipeSaudi ArabiaSenegalSeychellesSierra LeoneSingaporeSlovak RepublicSloveniaSmall statesSolomon IslandsSouth AfricaSouth AsiaSouth Asia (IDA & IBRD)SpainSri LankaSt. LuciaSt. Vincent and the GrenadinesSub-Saharan Africa Sub-Saharan Africa (excluding high income)Sub-Saharan Africa (IDA & IBRD countries)SurinameSwazilandSwedenSwitzerlandTajikistanTanzaniaThailandTogoTongaTrinidad and TobagoTunisiaTurkeyTurkmenistanUgandaUkraineUnited Arab EmiratesUnited KingdomUnited StatesUpper middle incomeUruguayUzbekistanVanuatuVenezuela, RBVietnamWorldYemen, Rep.ZambiaZimbabwe Timeline:
This timeline shows a graph from 1971 to 2015 of Japan. No data until 1970. Number of actual observations by date: 45.
Source name:
World Development Indicators
Source organization:
World Bank staff estimates based on sources and methods in World Bank's "The Changing Wealth of Nations: Measuring Sustainable Development in the New Millennium" (2011).
Categories, topics:
Economy & Growth
Last updated:
apr 23, 2017
Indicators value changes by year
Minimum:
1.694 trl
jan 1, 1971
Maximum:
4.7 trl
jan 1, 2008
At the date of observation
Value
Absolute change
Change from previous value
jan 1, 1971
1.694 trl
+1.694 trl
0.0%
jan 1, 1972
1.79 trl
+95.905 bln
5.66%
jan 1, 1973
1.932 trl
+142.656 bln
7.97%
jan 1, 1974
2.075 trl
+142.878 bln
7.39%
jan 1, 1975
2.028 trl
-47.573 bln
-2.29%
jan 1, 1976
2.1 trl
+71.939 bln
3.55%
jan 1, 1977
2.203 trl
+103.389 bln
4.92%
jan 1, 1978
2.312 trl
+108.42 bln
4.92%
jan 1, 1979
2.456 trl
+144.273 bln
6.24%
jan 1, 1980
2.534 trl
+78.562 bln
3.2%
jan 1, 1981
2.545 trl
+10.26 bln
0.4%
jan 1, 1982
2.652 trl
+106.922 bln
4.2%
jan 1, 1983
2.734 trl
+82.122 bln
3.1%
jan 1, 1984
2.822 trl
+88.537 bln
3.24%
jan 1, 1985
2.97 trl
+147.781 bln
5.24%
jan 1, 1986
3.17 trl
+199.975 bln
6.73%
jan 1, 1987
3.289 trl
+118.719 bln
3.75%
jan 1, 1988
3.407 trl
+118.495 bln
3.6%
jan 1, 1989
3.652 trl
+244.622 bln
7.18%
jan 1, 1990
3.829 trl
+176.858 bln
4.84%
jan 1, 1991
4.012 trl
+183.15 bln
4.78%
jan 1, 1992
4.116 trl
+104.556 bln
2.61%
jan 1, 1993
4.123 trl
+6.945 bln
0.17%
jan 1, 1994
4.099 trl
-24.31 bln
-0.59%
jan 1, 1995
4.076 trl
-22.804 bln
-0.56%
jan 1, 1996
4.182 trl
+105.457 bln
2.59%
jan 1, 1997
4.305 trl
+122.924 bln
2.94%
jan 1, 1998
4.353 trl
+48.707 bln
1.13%
jan 1, 1999
4.241 trl
-112.553 bln
-2.59%
jan 1, 2000
4.225 trl
-15.768 bln
-0.37%
jan 1, 2001
4.326 trl
+101.422 bln
2.4%
jan 1, 2002
4.356 trl
+29.785 bln
0.69%
jan 1, 2003
4.359 trl
+2.542 bln
0.06%
jan 1, 2004
4.435 trl
+76.069 bln
1.75%
jan 1, 2005
4.537 trl
+101.944 bln
2.3%
jan 1, 2006
4.576 trl
+38.805 bln
0.86%
jan 1, 2007
4.612 trl
+36.093 bln
0.79%
jan 1, 2008
4.7 trl
+88.491 bln
1.92%
jan 1, 2009
4.506 trl
-193.627 bln
-4.12%
jan 1, 2010
4.246 trl
-260.739 bln
-5.79%
jan 1, 2011
4.46 trl
+214.401 bln
5.05%
jan 1, 2012
4.398 trl
-61.951 bln
-1.39%
jan 1, 2013
4.485 trl
+86.632 bln
1.97%
jan 1, 2014
4.555 trl
+70.498 bln
1.57%
jan 1, 2015
4.523 trl
-31.911 bln
-0.7%
Ranking of countries by current statistics by years


Comments: