29
/
en
AIzaSyAYiBZKx7MnpbEhh9jyipgxe19OcubqV5w
April 1, 2024
240162
Singapore
SGP
true
2
1
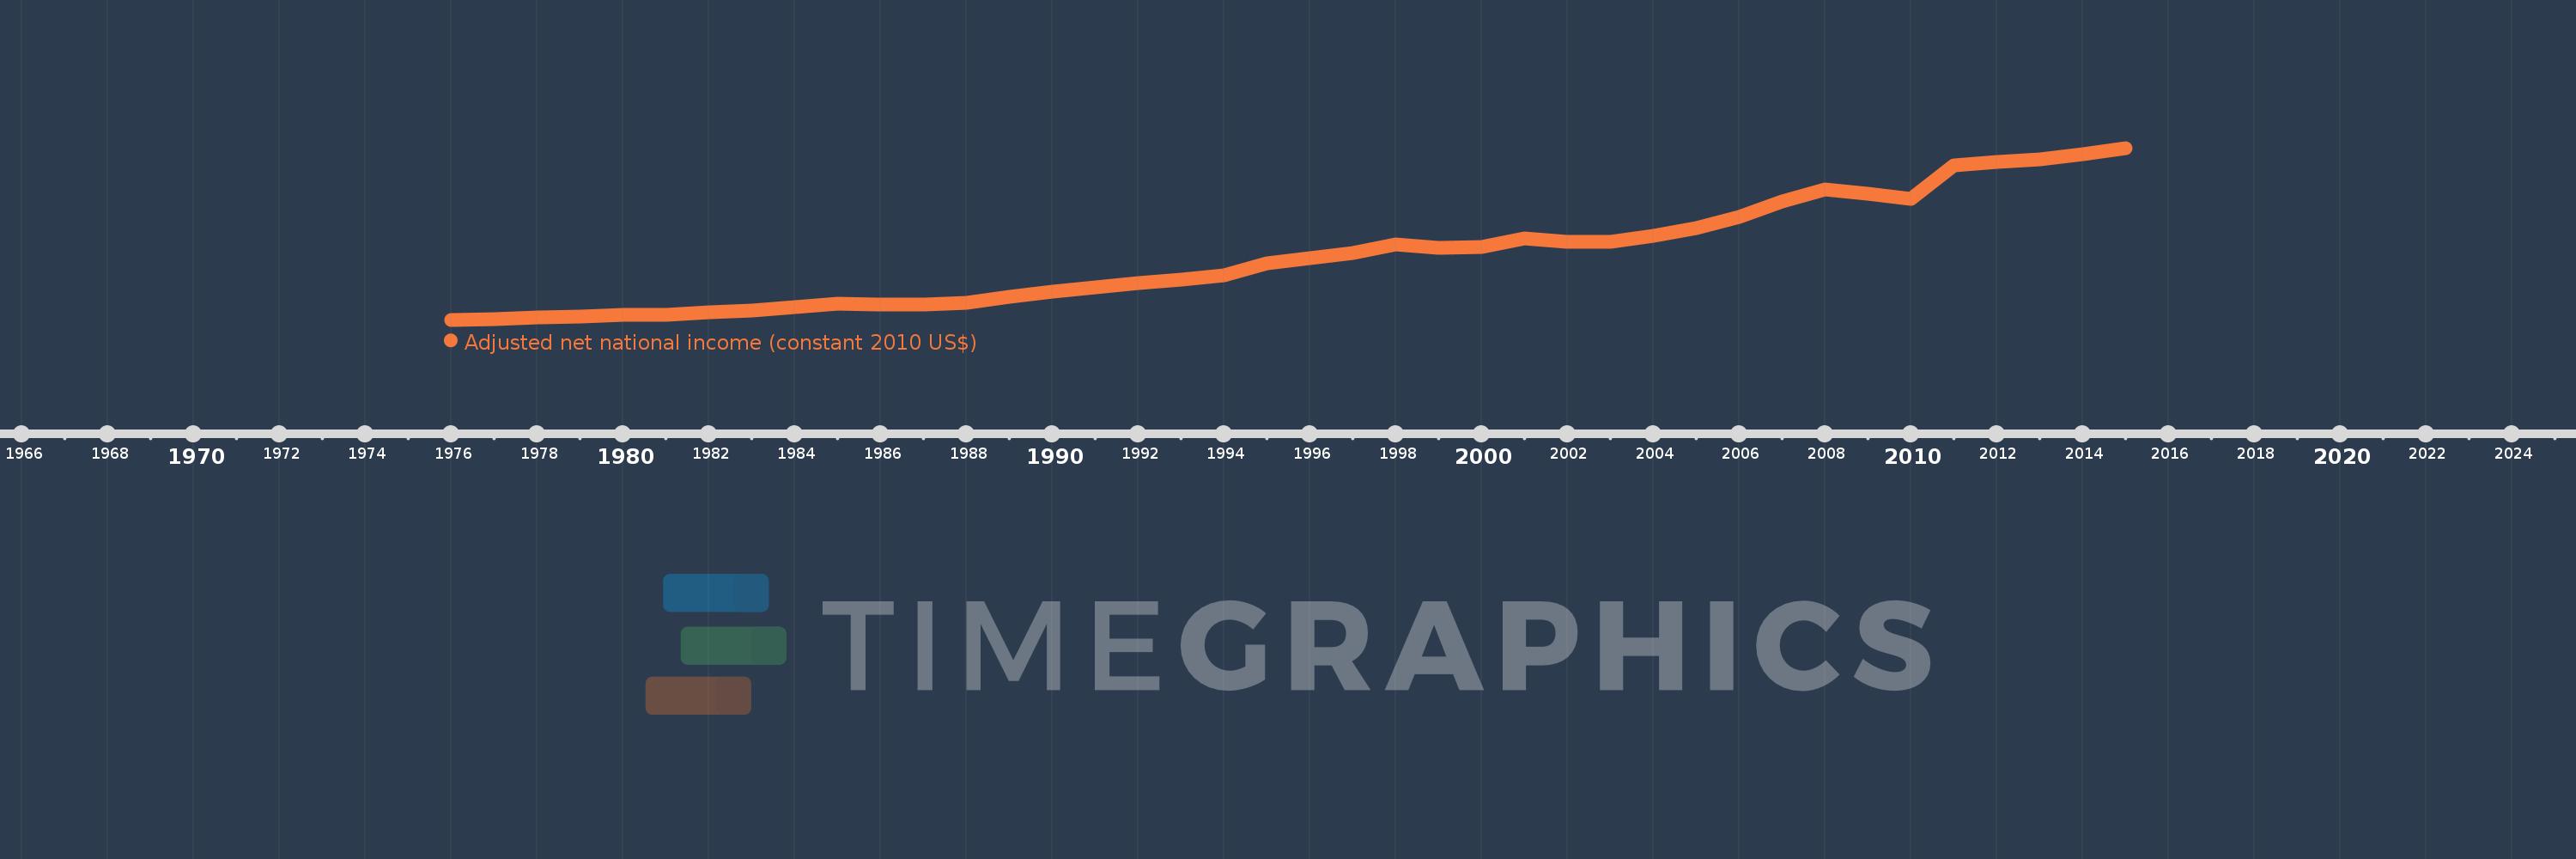
Adjusted net national income (constant 2010 US$)
2015,2014,2013,2012,2011,2010,2009,2008,2007,2006,2005,2004,2003,2002,2001,2000,1999,1998,1997,1996,1995,1994,1993,1992,1991,1990,1989,1988,1987,1986,1985,1984,1983,1982,1981,1980,1979,1978,1977,1976
This statistics in other country:
AfghanistanAlbaniaAlgeriaAngolaArab WorldArgentinaArmeniaAustraliaAustriaAzerbaijanBahamas, TheBahrainBangladeshBarbadosBelarusBelgiumBelizeBeninBhutanBoliviaBotswanaBrazilBulgariaBurkina FasoBurundiCabo VerdeCambodiaCameroonCanadaCaribbean small statesCentral African RepublicCentral Europe and the BalticsChadChileChinaColombiaComorosCongo, Dem. Rep.Congo, Rep.Costa RicaCote d'IvoireCroatiaCubaCyprusCzech RepublicDenmarkDominicaDominican RepublicEarly-demographic dividendEast Asia & PacificEast Asia & Pacific (excluding high income)East Asia & Pacific (IDA & IBRD countries)EcuadorEgypt, Arab Rep.El SalvadorEritreaEstoniaEthiopiaEuro areaEurope & Central AsiaEurope & Central Asia (excluding high income)Europe & Central Asia (IDA & IBRD countries)European UnionFijiFinlandFragile and conflict affected situationsFranceGabonGambia, TheGeorgiaGermanyGhanaGreeceGuatemalaGuineaGuinea-BissauGuyanaHaitiHeavily indebted poor countries (HIPC)High incomeHondurasHungaryIBRD onlyIDA & IBRD totalIDA blendIDA onlyIDA totalIndiaIndonesiaIran, Islamic Rep.IraqIrelandIsraelItalyJamaicaJapanJordanKazakhstanKenyaKiribatiKorea, Rep.KuwaitKyrgyz RepublicLao PDRLate-demographic dividendLatin America & Caribbean Latin America & Caribbean (excluding high income)Latin America & the Caribbean (IDA & IBRD countries)LatviaLeast developed countries: UN classificationLebanonLesothoLiberiaLibyaLithuaniaLow & middle incomeLow incomeLower middle incomeLuxembourgMacedonia, FYRMadagascarMalawiMalaysiaMaldivesMaliMauritaniaMauritiusMexicoMiddle East & North AfricaMiddle East & North Africa (excluding high income)Middle East & North Africa (IDA & IBRD countries)Middle incomeMoldovaMongoliaMoroccoMozambiqueNamibiaNepalNetherlandsNew ZealandNicaraguaNigerNigeriaNorth AmericaNorwayOECD membersOmanOther small statesPacific island small statesPakistanPanamaPapua New GuineaParaguayPeruPhilippinesPolandPortugalPost-demographic dividendPre-demographic dividendQatarRomaniaRussian FederationRwandaSamoaSao Tome and PrincipeSaudi ArabiaSenegalSeychellesSierra LeoneSingaporeSlovak RepublicSloveniaSmall statesSolomon IslandsSouth AfricaSouth AsiaSouth Asia (IDA & IBRD)SpainSri LankaSt. LuciaSt. Vincent and the GrenadinesSub-Saharan Africa Sub-Saharan Africa (excluding high income)Sub-Saharan Africa (IDA & IBRD countries)SurinameSwazilandSwedenSwitzerlandTajikistanTanzaniaThailandTogoTongaTrinidad and TobagoTunisiaTurkeyTurkmenistanUgandaUkraineUnited Arab EmiratesUnited KingdomUnited StatesUpper middle incomeUruguayUzbekistanVanuatuVenezuela, RBVietnamWorldYemen, Rep.ZambiaZimbabwe Timeline:
This timeline shows a graph from 1976 to 2015 of Singapore. No data until 1975. Number of actual observations by date: 40.
Source name:
World Development Indicators
Source organization:
World Bank staff estimates based on sources and methods in World Bank's "The Changing Wealth of Nations: Measuring Sustainable Development in the New Millennium" (2011).
Categories, topics:
Economy & Growth
Last updated:
apr 23, 2017
Indicators value changes by year
Minimum:
17.87 bln
jan 1, 1976
Maximum:
225.595 bln
jan 1, 2015
At the date of observation
Value
Absolute change
Change from previous value
jan 1, 1976
17.87 bln
+17.87 bln
0.0%
jan 1, 1977
18.895 bln
+1.025 bln
5.74%
jan 1, 1978
20.566 bln
+1.671 bln
8.84%
jan 1, 1979
22.211 bln
+1.645 bln
8.0%
jan 1, 1980
23.607 bln
+1.396 bln
6.28%
jan 1, 1981
23.978 bln
+371.487 mln
1.57%
jan 1, 1982
26.621 bln
+2.643 bln
11.02%
jan 1, 1983
29.261 bln
+2.64 bln
9.92%
jan 1, 1984
33.271 bln
+4.01 bln
13.7%
jan 1, 1985
36.814 bln
+3.543 bln
10.65%
jan 1, 1986
36.536 bln
-278.754 mln
-0.76%
jan 1, 1987
36.237 bln
-298.008 mln
-0.82%
jan 1, 1988
38.83 bln
+2.593 bln
7.16%
jan 1, 1989
45.698 bln
+6.868 bln
17.69%
jan 1, 1990
51.972 bln
+6.274 bln
13.73%
jan 1, 1991
57.457 bln
+5.485 bln
10.55%
jan 1, 1992
62.127 bln
+4.67 bln
8.13%
jan 1, 1993
66.872 bln
+4.745 bln
7.64%
jan 1, 1994
71.839 bln
+4.967 bln
7.43%
jan 1, 1995
85.878 bln
+14.039 bln
19.54%
jan 1, 1996
92.397 bln
+6.52 bln
7.59%
jan 1, 1997
98.298 bln
+5.9 bln
6.39%
jan 1, 1998
108.726 bln
+10.428 bln
10.61%
jan 1, 1999
104.89 bln
-3.836 bln
-3.53%
jan 1, 2000
105.566 bln
+676.192 mln
0.64%
jan 1, 2001
116.159 bln
+10.593 bln
10.03%
jan 1, 2002
112.101 bln
-4.058 bln
-3.49%
jan 1, 2003
112.493 bln
+391.843 mln
0.35%
jan 1, 2004
119.567 bln
+7.074 bln
6.29%
jan 1, 2005
128.34 bln
+8.773 bln
7.34%
jan 1, 2006
141.689 bln
+13.35 bln
10.4%
jan 1, 2007
160.375 bln
+18.685 bln
13.19%
jan 1, 2008
175.71 bln
+15.336 bln
9.56%
jan 1, 2009
170.106 bln
-5.605 bln
-3.19%
jan 1, 2010
164.303 bln
-5.803 bln
-3.41%
jan 1, 2011
204.295 bln
+39.992 bln
24.34%
jan 1, 2012
208.522 bln
+4.227 bln
2.07%
jan 1, 2013
211.634 bln
+3.112 bln
1.49%
jan 1, 2014
218.319 bln
+6.685 bln
3.16%
jan 1, 2015
225.595 bln
+7.276 bln
3.33%
Ranking of countries by current statistics by years


Comments: