29
/
en
AIzaSyAYiBZKx7MnpbEhh9jyipgxe19OcubqV5w
April 1, 2024
152185
Hungary
HUN
true
2
1
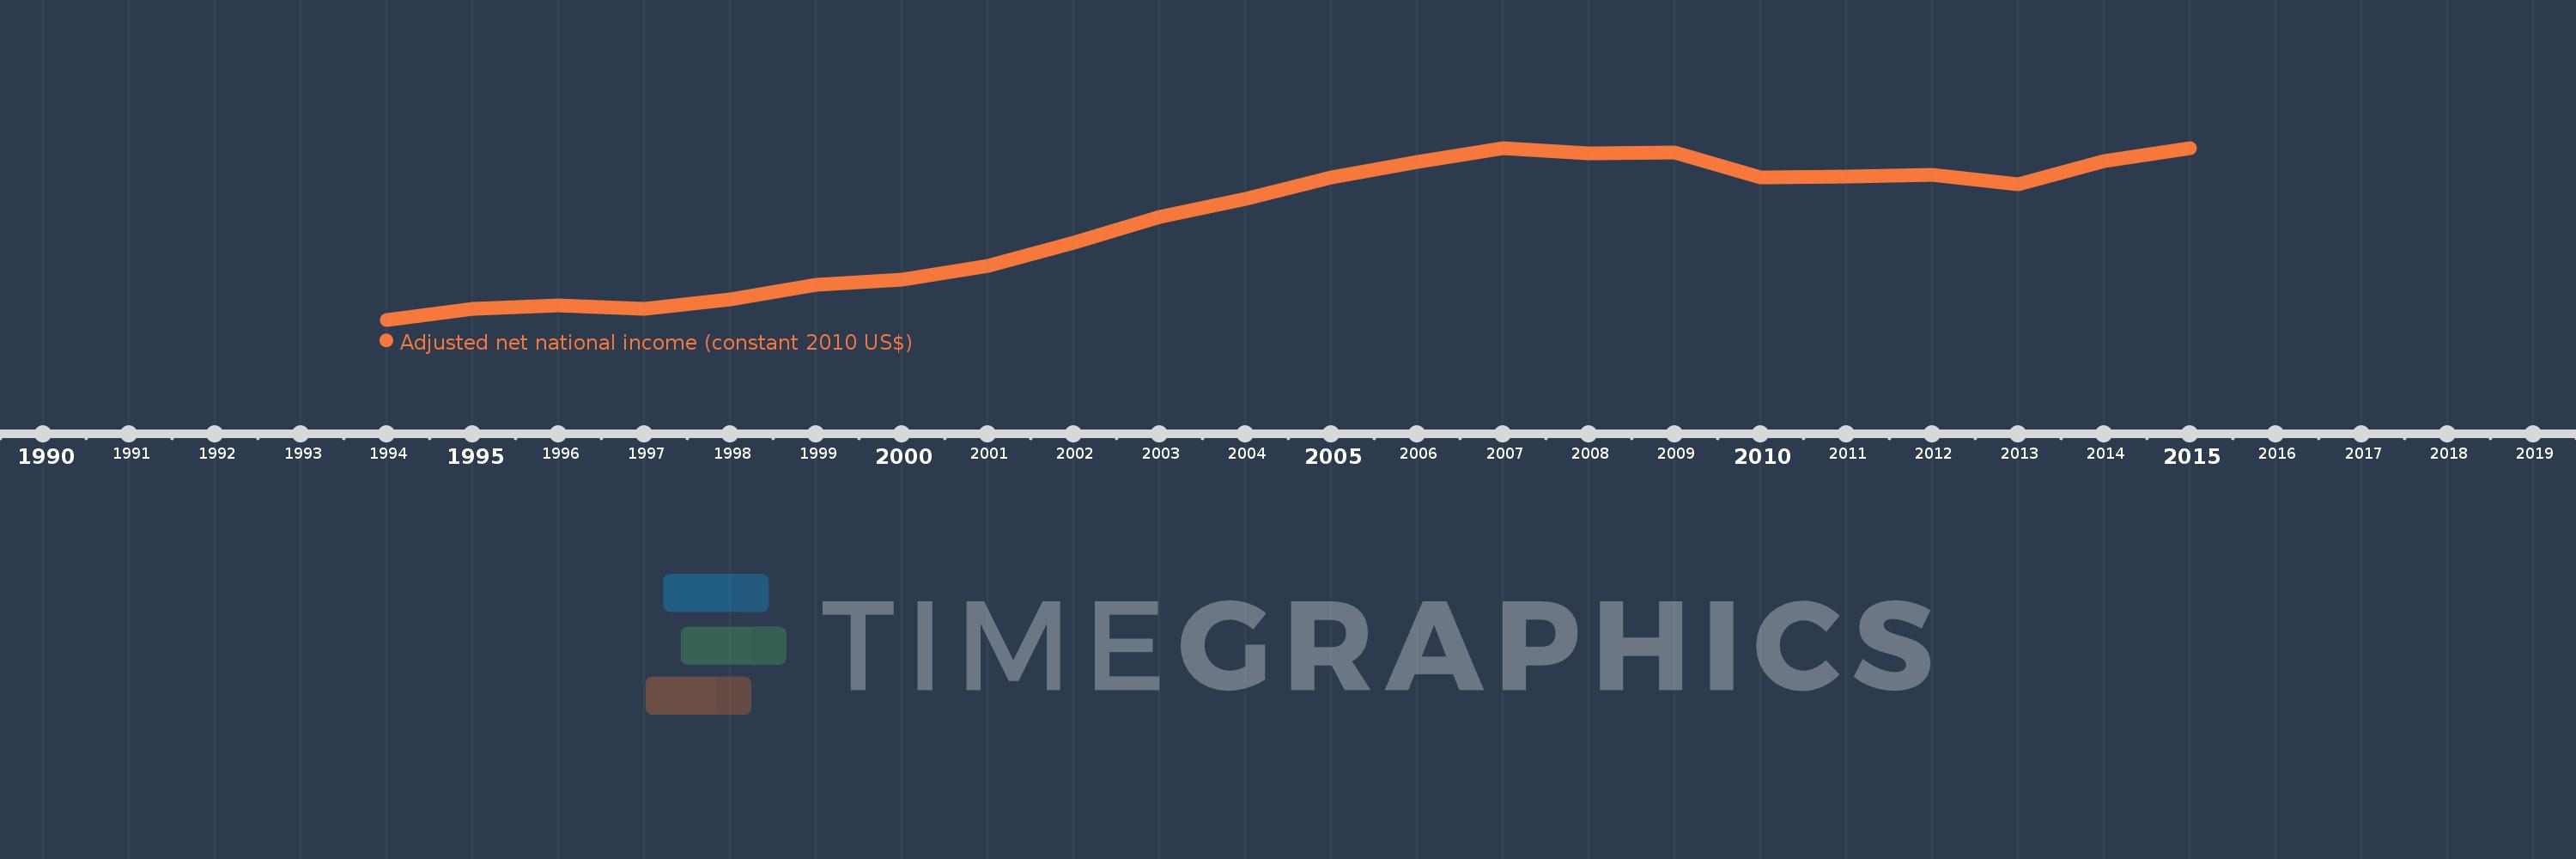
Adjusted net national income (constant 2010 US$)
2015,2014,2013,2012,2011,2010,2009,2008,2007,2006,2005,2004,2003,2002,2001,2000,1999,1998,1997,1996,1995,1994
This statistics in other country:
AfghanistanAlbaniaAlgeriaAngolaArab WorldArgentinaArmeniaAustraliaAustriaAzerbaijanBahamas, TheBahrainBangladeshBarbadosBelarusBelgiumBelizeBeninBhutanBoliviaBotswanaBrazilBulgariaBurkina FasoBurundiCabo VerdeCambodiaCameroonCanadaCaribbean small statesCentral African RepublicCentral Europe and the BalticsChadChileChinaColombiaComorosCongo, Dem. Rep.Congo, Rep.Costa RicaCote d'IvoireCroatiaCubaCyprusCzech RepublicDenmarkDominicaDominican RepublicEarly-demographic dividendEast Asia & PacificEast Asia & Pacific (excluding high income)East Asia & Pacific (IDA & IBRD countries)EcuadorEgypt, Arab Rep.El SalvadorEritreaEstoniaEthiopiaEuro areaEurope & Central AsiaEurope & Central Asia (excluding high income)Europe & Central Asia (IDA & IBRD countries)European UnionFijiFinlandFragile and conflict affected situationsFranceGabonGambia, TheGeorgiaGermanyGhanaGreeceGuatemalaGuineaGuinea-BissauGuyanaHaitiHeavily indebted poor countries (HIPC)High incomeHondurasHungaryIBRD onlyIDA & IBRD totalIDA blendIDA onlyIDA totalIndiaIndonesiaIran, Islamic Rep.IraqIrelandIsraelItalyJamaicaJapanJordanKazakhstanKenyaKiribatiKorea, Rep.KuwaitKyrgyz RepublicLao PDRLate-demographic dividendLatin America & Caribbean Latin America & Caribbean (excluding high income)Latin America & the Caribbean (IDA & IBRD countries)LatviaLeast developed countries: UN classificationLebanonLesothoLiberiaLibyaLithuaniaLow & middle incomeLow incomeLower middle incomeLuxembourgMacedonia, FYRMadagascarMalawiMalaysiaMaldivesMaliMauritaniaMauritiusMexicoMiddle East & North AfricaMiddle East & North Africa (excluding high income)Middle East & North Africa (IDA & IBRD countries)Middle incomeMoldovaMongoliaMoroccoMozambiqueNamibiaNepalNetherlandsNew ZealandNicaraguaNigerNigeriaNorth AmericaNorwayOECD membersOmanOther small statesPacific island small statesPakistanPanamaPapua New GuineaParaguayPeruPhilippinesPolandPortugalPost-demographic dividendPre-demographic dividendQatarRomaniaRussian FederationRwandaSamoaSao Tome and PrincipeSaudi ArabiaSenegalSeychellesSierra LeoneSingaporeSlovak RepublicSloveniaSmall statesSolomon IslandsSouth AfricaSouth AsiaSouth Asia (IDA & IBRD)SpainSri LankaSt. LuciaSt. Vincent and the GrenadinesSub-Saharan Africa Sub-Saharan Africa (excluding high income)Sub-Saharan Africa (IDA & IBRD countries)SurinameSwazilandSwedenSwitzerlandTajikistanTanzaniaThailandTogoTongaTrinidad and TobagoTunisiaTurkeyTurkmenistanUgandaUkraineUnited Arab EmiratesUnited KingdomUnited StatesUpper middle incomeUruguayUzbekistanVanuatuVenezuela, RBVietnamWorldYemen, Rep.ZambiaZimbabwe Timeline:
This timeline shows a graph from 1994 to 2015 of Hungary. No data until 1993. Number of actual observations by date: 22.
Source name:
World Development Indicators
Source organization:
World Bank staff estimates based on sources and methods in World Bank's "The Changing Wealth of Nations: Measuring Sustainable Development in the New Millennium" (2011).
Categories, topics:
Economy & Growth
Last updated:
apr 23, 2017
Indicators value changes by year
Minimum:
67.548 bln
jan 1, 1994
Maximum:
106.342 bln
jan 1, 2007
At the date of observation
Value
Absolute change
Change from previous value
jan 1, 1994
67.548 bln
+67.548 bln
0.0%
jan 1, 1995
70.036 bln
+2.488 bln
3.68%
jan 1, 1996
70.883 bln
+846.691 mln
1.21%
jan 1, 1997
69.992 bln
-890.927 mln
-1.26%
jan 1, 1998
72.215 bln
+2.223 bln
3.18%
jan 1, 1999
75.445 bln
+3.23 bln
4.47%
jan 1, 2000
76.631 bln
+1.186 bln
1.57%
jan 1, 2001
79.707 bln
+3.077 bln
4.01%
jan 1, 2002
84.874 bln
+5.167 bln
6.48%
jan 1, 2003
90.679 bln
+5.805 bln
6.84%
jan 1, 2004
94.923 bln
+4.244 bln
4.68%
jan 1, 2005
99.674 bln
+4.751 bln
5.01%
jan 1, 2006
103.172 bln
+3.498 bln
3.51%
jan 1, 2007
106.342 bln
+3.17 bln
3.07%
jan 1, 2008
105.202 bln
-1.14 bln
-1.07%
jan 1, 2009
105.262 bln
+59.985 mln
0.06%
jan 1, 2010
99.614 bln
-5.648 bln
-5.37%
jan 1, 2011
99.851 bln
+236.662 mln
0.24%
jan 1, 2012
100.328 bln
+477.47 mln
0.48%
jan 1, 2013
98.162 bln
-2.166 bln
-2.16%
jan 1, 2014
103.296 bln
+5.135 bln
5.23%
jan 1, 2015
106.317 bln
+3.021 bln
2.92%
Ranking of countries by current statistics by years


Comments: