29
/
en
AIzaSyAYiBZKx7MnpbEhh9jyipgxe19OcubqV5w
April 1, 2024
86765
Bolivia
BOL
true
2
1
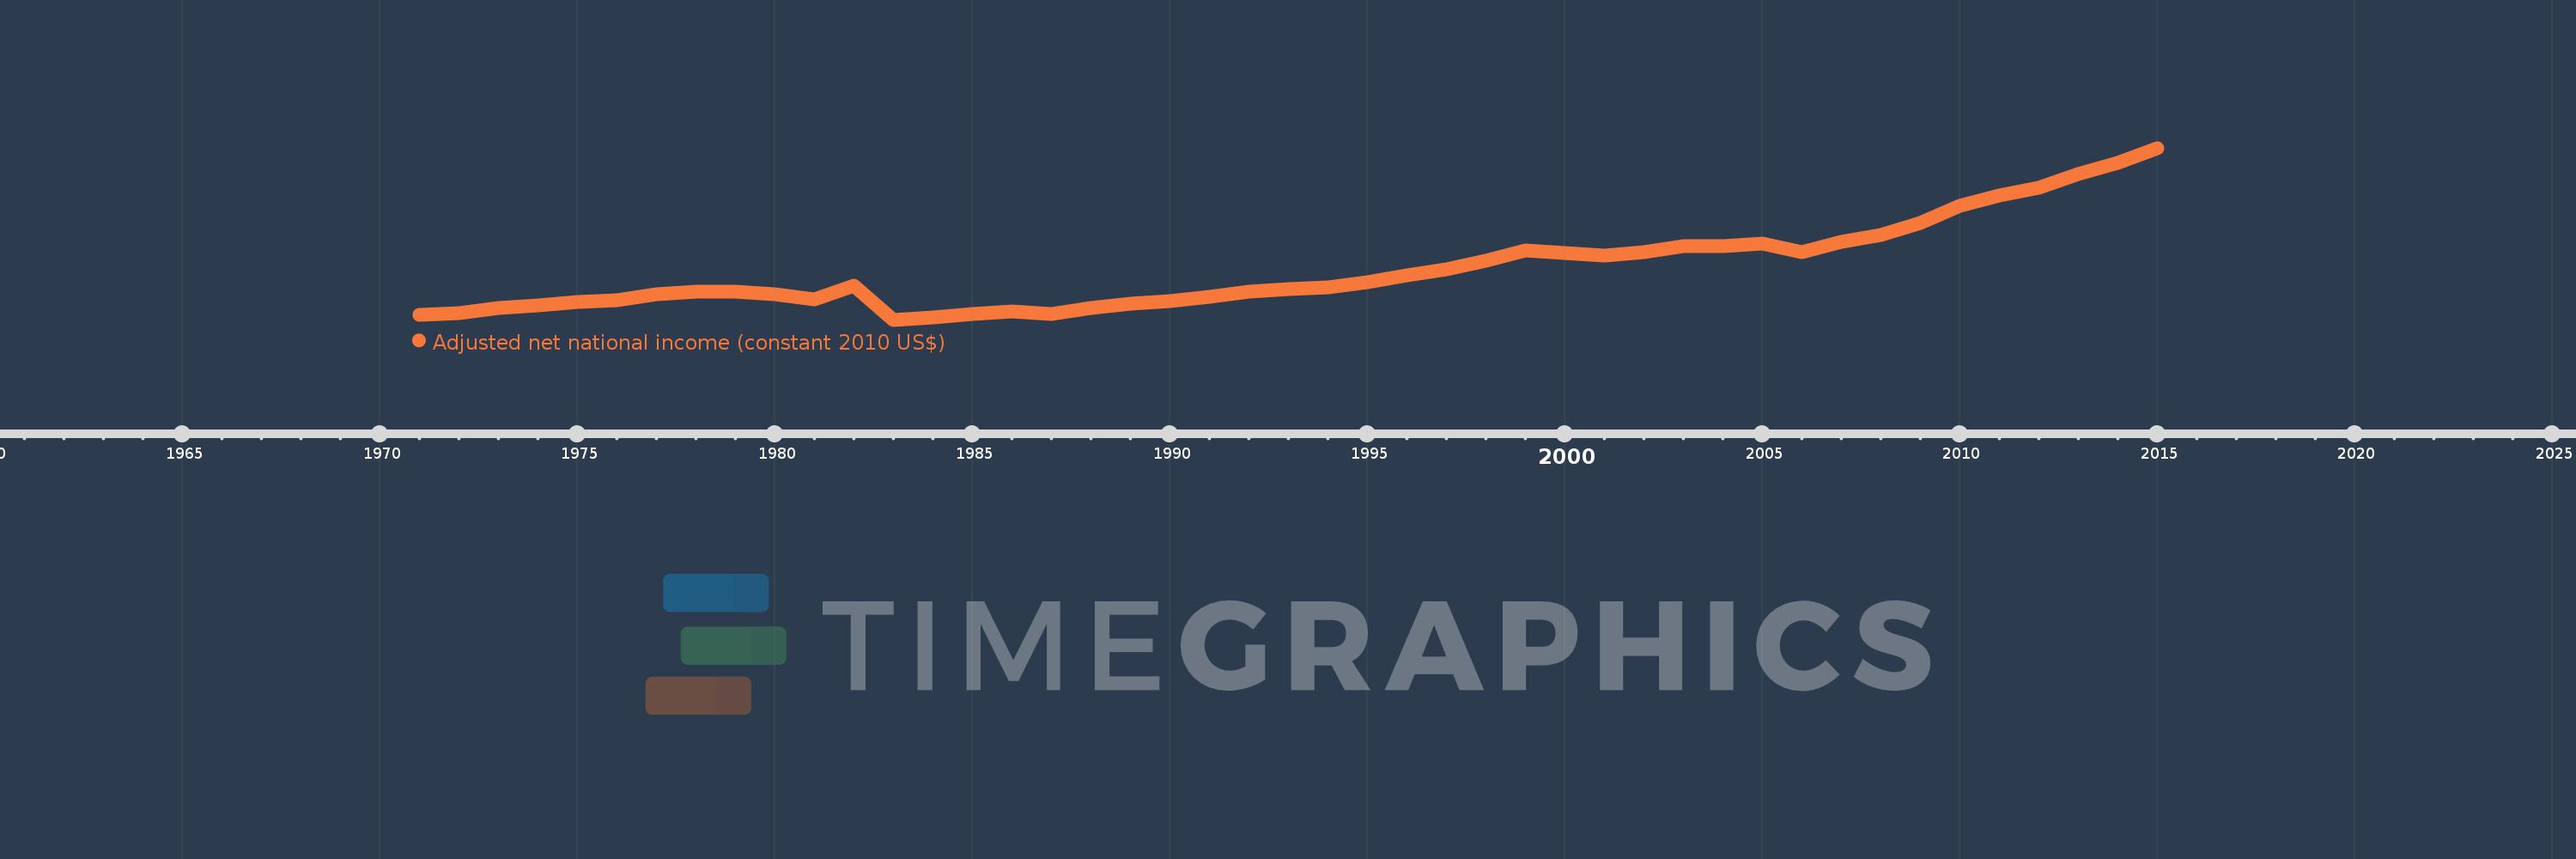
Adjusted net national income (constant 2010 US$)
2015,2014,2013,2012,2011,2010,2009,2008,2007,2006,2005,2004,2003,2002,2001,2000,1999,1998,1997,1996,1995,1994,1993,1992,1991,1990,1989,1988,1987,1986,1985,1984,1983,1982,1981,1980,1979,1978,1977,1976,1975,1974,1973,1972,1971
This statistics in other country:
AfghanistanAlbaniaAlgeriaAngolaArab WorldArgentinaArmeniaAustraliaAustriaAzerbaijanBahamas, TheBahrainBangladeshBarbadosBelarusBelgiumBelizeBeninBhutanBoliviaBotswanaBrazilBulgariaBurkina FasoBurundiCabo VerdeCambodiaCameroonCanadaCaribbean small statesCentral African RepublicCentral Europe and the BalticsChadChileChinaColombiaComorosCongo, Dem. Rep.Congo, Rep.Costa RicaCote d'IvoireCroatiaCubaCyprusCzech RepublicDenmarkDominicaDominican RepublicEarly-demographic dividendEast Asia & PacificEast Asia & Pacific (excluding high income)East Asia & Pacific (IDA & IBRD countries)EcuadorEgypt, Arab Rep.El SalvadorEritreaEstoniaEthiopiaEuro areaEurope & Central AsiaEurope & Central Asia (excluding high income)Europe & Central Asia (IDA & IBRD countries)European UnionFijiFinlandFragile and conflict affected situationsFranceGabonGambia, TheGeorgiaGermanyGhanaGreeceGuatemalaGuineaGuinea-BissauGuyanaHaitiHeavily indebted poor countries (HIPC)High incomeHondurasHungaryIBRD onlyIDA & IBRD totalIDA blendIDA onlyIDA totalIndiaIndonesiaIran, Islamic Rep.IraqIrelandIsraelItalyJamaicaJapanJordanKazakhstanKenyaKiribatiKorea, Rep.KuwaitKyrgyz RepublicLao PDRLate-demographic dividendLatin America & Caribbean Latin America & Caribbean (excluding high income)Latin America & the Caribbean (IDA & IBRD countries)LatviaLeast developed countries: UN classificationLebanonLesothoLiberiaLibyaLithuaniaLow & middle incomeLow incomeLower middle incomeLuxembourgMacedonia, FYRMadagascarMalawiMalaysiaMaldivesMaliMauritaniaMauritiusMexicoMiddle East & North AfricaMiddle East & North Africa (excluding high income)Middle East & North Africa (IDA & IBRD countries)Middle incomeMoldovaMongoliaMoroccoMozambiqueNamibiaNepalNetherlandsNew ZealandNicaraguaNigerNigeriaNorth AmericaNorwayOECD membersOmanOther small statesPacific island small statesPakistanPanamaPapua New GuineaParaguayPeruPhilippinesPolandPortugalPost-demographic dividendPre-demographic dividendQatarRomaniaRussian FederationRwandaSamoaSao Tome and PrincipeSaudi ArabiaSenegalSeychellesSierra LeoneSingaporeSlovak RepublicSloveniaSmall statesSolomon IslandsSouth AfricaSouth AsiaSouth Asia (IDA & IBRD)SpainSri LankaSt. LuciaSt. Vincent and the GrenadinesSub-Saharan Africa Sub-Saharan Africa (excluding high income)Sub-Saharan Africa (IDA & IBRD countries)SurinameSwazilandSwedenSwitzerlandTajikistanTanzaniaThailandTogoTongaTrinidad and TobagoTunisiaTurkeyTurkmenistanUgandaUkraineUnited Arab EmiratesUnited KingdomUnited StatesUpper middle incomeUruguayUzbekistanVanuatuVenezuela, RBVietnamWorldYemen, Rep.ZambiaZimbabwe Timeline:
This timeline shows a graph from 1971 to 2015 of Bolivia. No data until 1970. Number of actual observations by date: 45.
Source name:
World Development Indicators
Source organization:
World Bank staff estimates based on sources and methods in World Bank's "The Changing Wealth of Nations: Measuring Sustainable Development in the New Millennium" (2011).
Categories, topics:
Economy & Growth
Last updated:
apr 23, 2017
Indicators value changes by year
Minimum:
5.464 bln
jan 1, 1983
Maximum:
18.425 bln
jan 1, 2015
At the date of observation
Value
Absolute change
Change from previous value
jan 1, 1971
5.855 bln
+5.855 bln
0.0%
jan 1, 1972
5.941 bln
+86.413 mln
1.48%
jan 1, 1973
6.354 bln
+412.891 mln
6.95%
jan 1, 1974
6.524 bln
+169.831 mln
2.67%
jan 1, 1975
6.827 bln
+302.806 mln
4.64%
jan 1, 1976
6.967 bln
+140.192 mln
2.05%
jan 1, 1977
7.404 bln
+437.255 mln
6.28%
jan 1, 1978
7.615 bln
+210.907 mln
2.85%
jan 1, 1979
7.567 bln
-47.912 mln
-0.63%
jan 1, 1980
7.393 bln
-174.194 mln
-2.3%
jan 1, 1981
6.981 bln
-411.402 mln
-5.56%
jan 1, 1982
8.062 bln
+1.081 bln
15.49%
jan 1, 1983
5.464 bln
-2.598 bln
-32.22%
jan 1, 1984
5.622 bln
+157.639 mln
2.88%
jan 1, 1985
5.89 bln
+267.864 mln
4.76%
jan 1, 1986
6.072 bln
+181.914 mln
3.09%
jan 1, 1987
5.925 bln
-146.315 mln
-2.41%
jan 1, 1988
6.363 bln
+438.012 mln
7.39%
jan 1, 1989
6.703 bln
+339.742 mln
5.34%
jan 1, 1990
6.862 bln
+158.643 mln
2.37%
jan 1, 1991
7.183 bln
+321.021 mln
4.68%
jan 1, 1992
7.595 bln
+412.327 mln
5.74%
jan 1, 1993
7.749 bln
+153.39 mln
2.02%
jan 1, 1994
7.927 bln
+178.471 mln
2.3%
jan 1, 1995
8.29 bln
+362.703 mln
4.58%
jan 1, 1996
8.79 bln
+500.422 mln
6.04%
jan 1, 1997
9.267 bln
+476.864 mln
5.42%
jan 1, 1998
9.897 bln
+629.469 mln
6.79%
jan 1, 1999
10.69 bln
+793.96 mln
8.02%
jan 1, 2000
10.497 bln
-193.035 mln
-1.81%
jan 1, 2001
10.275 bln
-222.836 mln
-2.12%
jan 1, 2002
10.555 bln
+280.597 mln
2.73%
jan 1, 2003
11.033 bln
+477.371 mln
4.52%
jan 1, 2004
11.003 bln
-29.818 mln
-0.27%
jan 1, 2005
11.215 bln
+212.047 mln
1.93%
jan 1, 2006
10.553 bln
-661.819 mln
-5.9%
jan 1, 2007
11.373 bln
+819.783 mln
7.77%
jan 1, 2008
11.841 bln
+468.234 mln
4.12%
jan 1, 2009
12.765 bln
+924.466 mln
7.81%
jan 1, 2010
14.046 bln
+1.281 bln
10.03%
jan 1, 2011
14.834 bln
+788.376 mln
5.61%
jan 1, 2012
15.442 bln
+607.909 mln
4.1%
jan 1, 2013
16.432 bln
+989.574 mln
6.41%
jan 1, 2014
17.272 bln
+839.955 mln
5.11%
jan 1, 2015
18.425 bln
+1.153 bln
6.68%
Ranking of countries by current statistics by years


Comments: