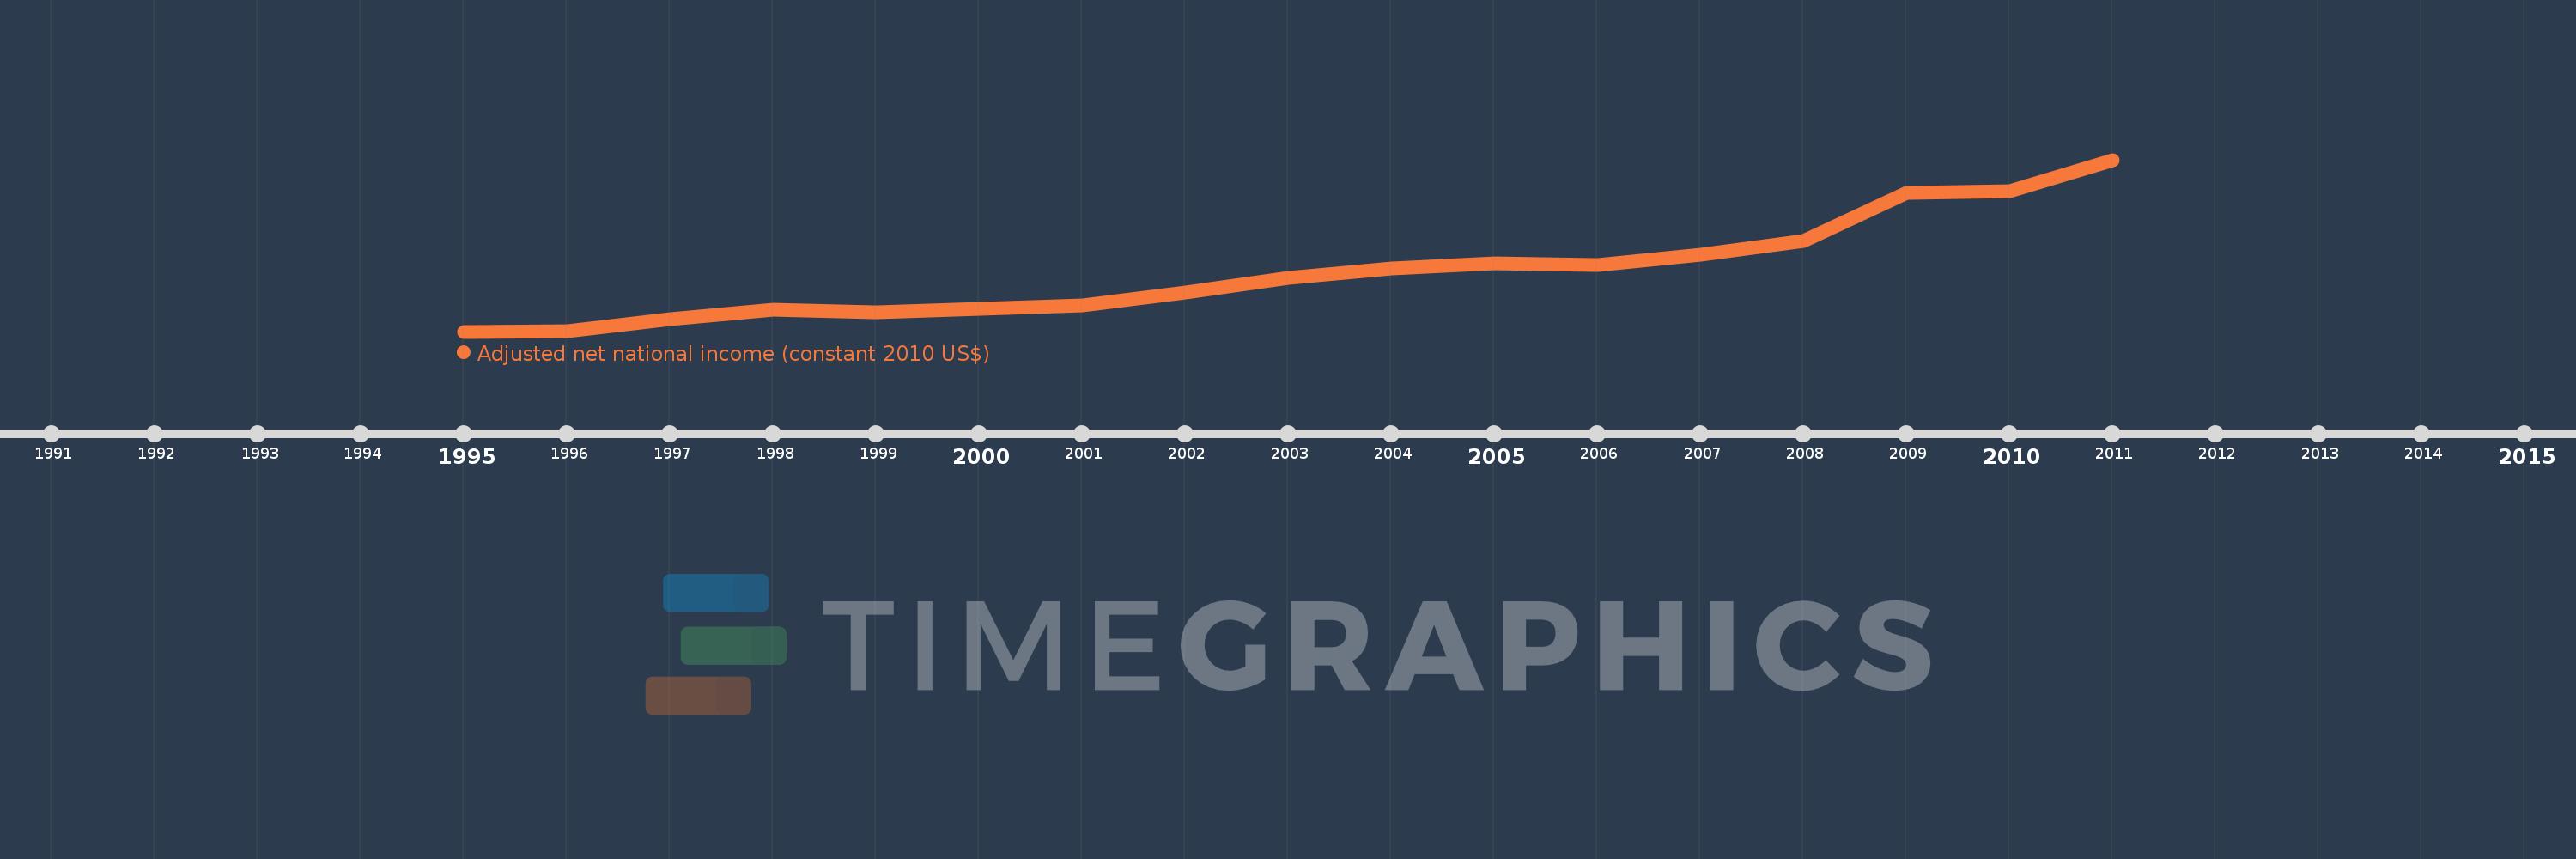
This timeline shows a graph from 1995 to 2011 of Zambia. No data until 1994. Number of actual observations by date: 17.
Source name:
World Development Indicators
Source organization:
World Bank staff estimates based on sources and methods in World Bank's "The Changing Wealth of Nations: Measuring Sustainable Development in the New Millennium" (2011).
Categories, topics:
Economy & Growth
Last updated:
apr 23, 2017
Indicators value changes by year
Meaning:
8.5 bln
Minimum:
6.018 bln
jan 1, 1995
Maximum:
13.179 bln
jan 1, 2011
At the date of observation
Value
Absolute change
Change from the previous value
jan 1, 1995
6.018 bln
+6.018 bln
0.0%
jan 1, 1996
6.021 bln
+2.72 mln
0.05%
jan 1, 1997
6.523 bln
+502.216 mln
8.34%
jan 1, 1998
6.946 bln
+423.185 mln
6.49%
jan 1, 1999
6.825 bln
-121.185 mln
-1.74%
jan 1, 2000
6.983 bln
+158.222 mln
2.32%
jan 1, 2001
7.107 bln
+123.436 mln
1.77%
jan 1, 2002
7.645 bln
+537.739 mln
7.57%
jan 1, 2003
8.26 bln
+615.093 mln
8.05%
jan 1, 2004
8.639 bln
+379.548 mln
4.6%
jan 1, 2005
8.865 bln
+225.923 mln
2.62%
jan 1, 2006
8.787 bln
-78.429 mln
-0.88%
jan 1, 2007
9.22 bln
+433.462 mln
4.93%
jan 1, 2008
9.8 bln
+580.095 mln
6.29%
jan 1, 2009
11.809 bln
+2.009 bln
20.5%
jan 1, 2010
11.866 bln
+57.188 mln
0.48%
jan 1, 2011
13.179 bln
+1.312 bln
11.06%
Ranking of countries by current statistics by years
