29
/
en
AIzaSyAYiBZKx7MnpbEhh9jyipgxe19OcubqV5w
April 1, 2024
201169
Morocco
MAR
true
2
1
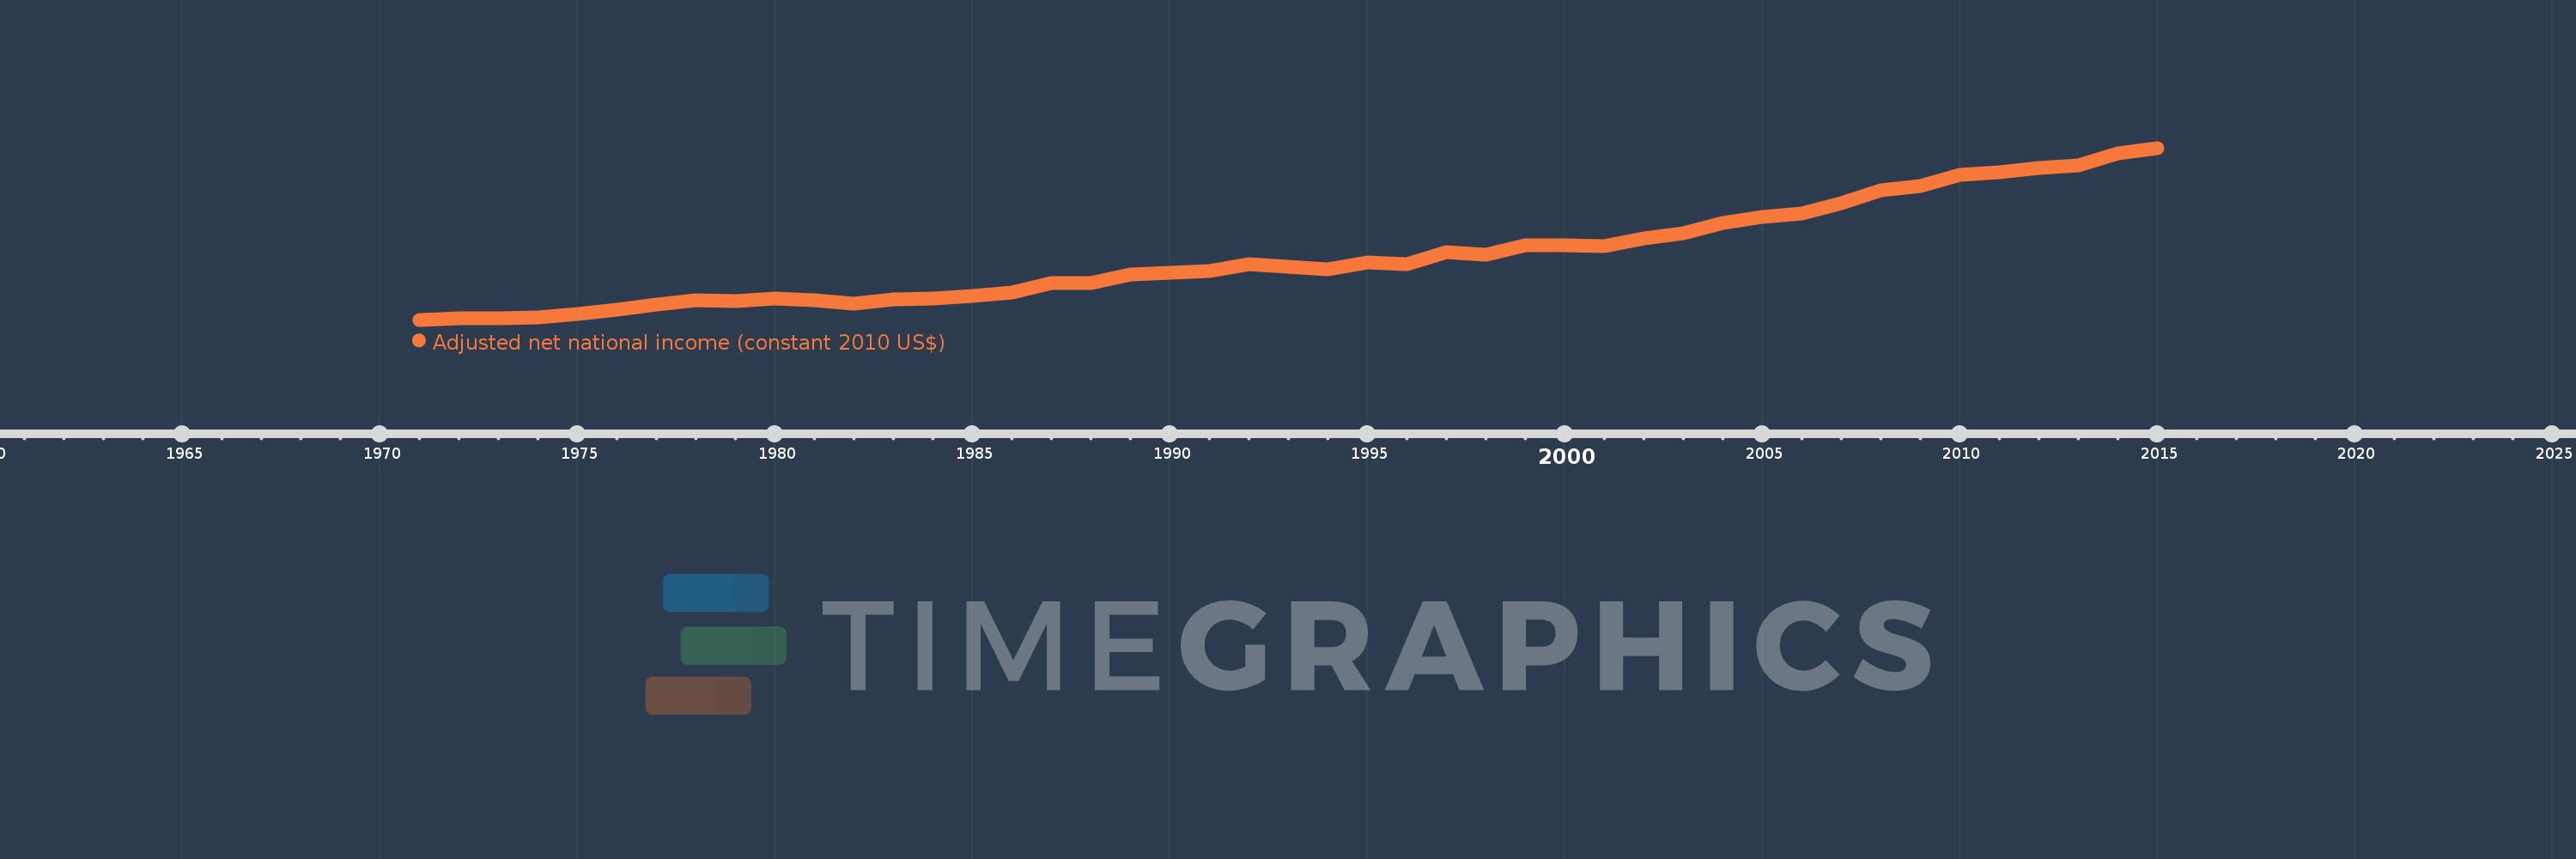
Adjusted net national income (constant 2010 US$)
2015,2014,2013,2012,2011,2010,2009,2008,2007,2006,2005,2004,2003,2002,2001,2000,1999,1998,1997,1996,1995,1994,1993,1992,1991,1990,1989,1988,1987,1986,1985,1984,1983,1982,1981,1980,1979,1978,1977,1976,1975,1974,1973,1972,1971
This statistics in other country:
AfghanistanAlbaniaAlgeriaAngolaArab WorldArgentinaArmeniaAustraliaAustriaAzerbaijanBahamas, TheBahrainBangladeshBarbadosBelarusBelgiumBelizeBeninBhutanBoliviaBotswanaBrazilBulgariaBurkina FasoBurundiCabo VerdeCambodiaCameroonCanadaCaribbean small statesCentral African RepublicCentral Europe and the BalticsChadChileChinaColombiaComorosCongo, Dem. Rep.Congo, Rep.Costa RicaCote d'IvoireCroatiaCubaCyprusCzech RepublicDenmarkDominicaDominican RepublicEarly-demographic dividendEast Asia & PacificEast Asia & Pacific (excluding high income)East Asia & Pacific (IDA & IBRD countries)EcuadorEgypt, Arab Rep.El SalvadorEritreaEstoniaEthiopiaEuro areaEurope & Central AsiaEurope & Central Asia (excluding high income)Europe & Central Asia (IDA & IBRD countries)European UnionFijiFinlandFragile and conflict affected situationsFranceGabonGambia, TheGeorgiaGermanyGhanaGreeceGuatemalaGuineaGuinea-BissauGuyanaHaitiHeavily indebted poor countries (HIPC)High incomeHondurasHungaryIBRD onlyIDA & IBRD totalIDA blendIDA onlyIDA totalIndiaIndonesiaIran, Islamic Rep.IraqIrelandIsraelItalyJamaicaJapanJordanKazakhstanKenyaKiribatiKorea, Rep.KuwaitKyrgyz RepublicLao PDRLate-demographic dividendLatin America & Caribbean Latin America & Caribbean (excluding high income)Latin America & the Caribbean (IDA & IBRD countries)LatviaLeast developed countries: UN classificationLebanonLesothoLiberiaLibyaLithuaniaLow & middle incomeLow incomeLower middle incomeLuxembourgMacedonia, FYRMadagascarMalawiMalaysiaMaldivesMaliMauritaniaMauritiusMexicoMiddle East & North AfricaMiddle East & North Africa (excluding high income)Middle East & North Africa (IDA & IBRD countries)Middle incomeMoldovaMongoliaMoroccoMozambiqueNamibiaNepalNetherlandsNew ZealandNicaraguaNigerNigeriaNorth AmericaNorwayOECD membersOmanOther small statesPacific island small statesPakistanPanamaPapua New GuineaParaguayPeruPhilippinesPolandPortugalPost-demographic dividendPre-demographic dividendQatarRomaniaRussian FederationRwandaSamoaSao Tome and PrincipeSaudi ArabiaSenegalSeychellesSierra LeoneSingaporeSlovak RepublicSloveniaSmall statesSolomon IslandsSouth AfricaSouth AsiaSouth Asia (IDA & IBRD)SpainSri LankaSt. LuciaSt. Vincent and the GrenadinesSub-Saharan Africa Sub-Saharan Africa (excluding high income)Sub-Saharan Africa (IDA & IBRD countries)SurinameSwazilandSwedenSwitzerlandTajikistanTanzaniaThailandTogoTongaTrinidad and TobagoTunisiaTurkeyTurkmenistanUgandaUkraineUnited Arab EmiratesUnited KingdomUnited StatesUpper middle incomeUruguayUzbekistanVanuatuVenezuela, RBVietnamWorldYemen, Rep.ZambiaZimbabwe Timeline:
This timeline shows a graph from 1971 to 2015 of Morocco. No data until 1970. Number of actual observations by date: 45.
Source name:
World Development Indicators
Source organization:
World Bank staff estimates based on sources and methods in World Bank's "The Changing Wealth of Nations: Measuring Sustainable Development in the New Millennium" (2011).
Categories, topics:
Economy & Growth
Last updated:
apr 23, 2017
Indicators value changes by year
Minimum:
14.863 bln
jan 1, 1971
Maximum:
88.987 bln
jan 1, 2015
At the date of observation
Value
Absolute change
Change from previous value
jan 1, 1971
14.863 bln
+14.863 bln
0.0%
jan 1, 1972
15.45 bln
+586.918 mln
3.95%
jan 1, 1973
15.465 bln
+15.133 mln
0.1%
jan 1, 1974
15.801 bln
+336.442 mln
2.18%
jan 1, 1975
17.19 bln
+1.389 bln
8.79%
jan 1, 1976
19.351 bln
+2.16 bln
12.57%
jan 1, 1977
21.28 bln
+1.93 bln
9.97%
jan 1, 1978
23.383 bln
+2.103 bln
9.88%
jan 1, 1979
22.817 bln
-566.088 mln
-2.42%
jan 1, 1980
23.926 bln
+1.11 bln
4.86%
jan 1, 1981
23.46 bln
-466.197 mln
-1.95%
jan 1, 1982
21.793 bln
-1.667 bln
-7.11%
jan 1, 1983
23.616 bln
+1.823 bln
8.37%
jan 1, 1984
24.06 bln
+444.008 mln
1.88%
jan 1, 1985
25.148 bln
+1.088 bln
4.52%
jan 1, 1986
26.625 bln
+1.477 bln
5.87%
jan 1, 1987
30.514 bln
+3.889 bln
14.61%
jan 1, 1988
30.533 bln
+18.654 mln
0.06%
jan 1, 1989
34.271 bln
+3.738 bln
12.24%
jan 1, 1990
35.096 bln
+825.039 mln
2.41%
jan 1, 1991
35.889 bln
+793.248 mln
2.26%
jan 1, 1992
38.795 bln
+2.906 bln
8.1%
jan 1, 1993
37.708 bln
-1.087 bln
-2.8%
jan 1, 1994
36.454 bln
-1.254 bln
-3.32%
jan 1, 1995
39.746 bln
+3.292 bln
9.03%
jan 1, 1996
38.969 bln
-776.93 mln
-1.95%
jan 1, 1997
43.894 bln
+4.925 bln
12.64%
jan 1, 1998
42.994 bln
-900.725 mln
-2.05%
jan 1, 1999
46.88 bln
+3.887 bln
9.04%
jan 1, 2000
47.001 bln
+120.944 mln
0.26%
jan 1, 2001
46.575 bln
-426.155 mln
-0.91%
jan 1, 2002
49.992 bln
+3.417 bln
7.34%
jan 1, 2003
52.211 bln
+2.219 bln
4.44%
jan 1, 2004
56.77 bln
+4.559 bln
8.73%
jan 1, 2005
59.284 bln
+2.515 bln
4.43%
jan 1, 2006
60.773 bln
+1.489 bln
2.51%
jan 1, 2007
65.087 bln
+4.313 bln
7.1%
jan 1, 2008
70.598 bln
+5.511 bln
8.47%
jan 1, 2009
72.387 bln
+1.789 bln
2.53%
jan 1, 2010
77.29 bln
+4.903 bln
6.77%
jan 1, 2011
78.612 bln
+1.322 bln
1.71%
jan 1, 2012
80.295 bln
+1.683 bln
2.14%
jan 1, 2013
81.467 bln
+1.172 bln
1.46%
jan 1, 2014
86.613 bln
+5.145 bln
6.32%
jan 1, 2015
88.987 bln
+2.374 bln
2.74%
Ranking of countries by current statistics by years


Comments: