29
/
en
AIzaSyAYiBZKx7MnpbEhh9jyipgxe19OcubqV5w
April 1, 2024
155527
Indonesia
IDN
true
2
1
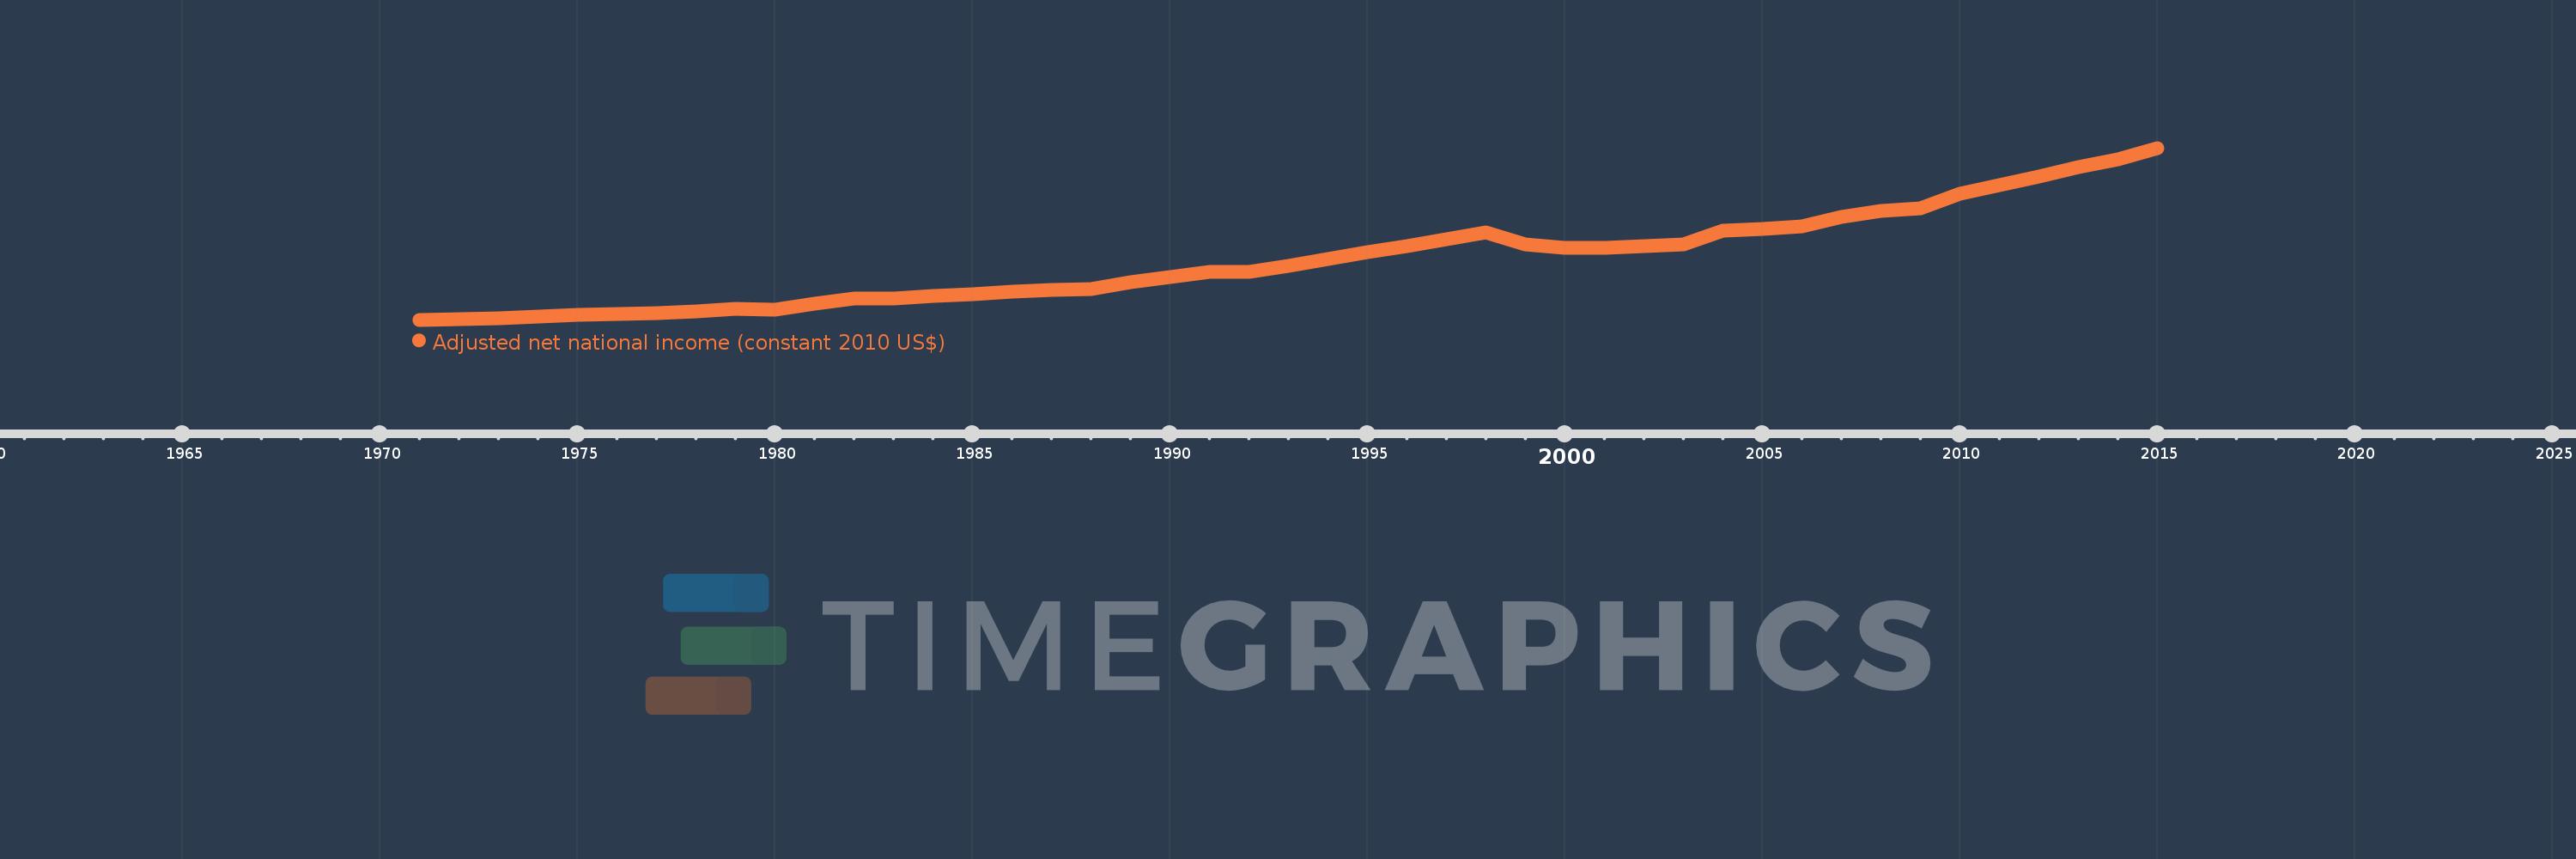
Adjusted net national income (constant 2010 US$)
2015,2014,2013,2012,2011,2010,2009,2008,2007,2006,2005,2004,2003,2002,2001,2000,1999,1998,1997,1996,1995,1994,1993,1992,1991,1990,1989,1988,1987,1986,1985,1984,1983,1982,1981,1980,1979,1978,1977,1976,1975,1974,1973,1972,1971
This statistics in other country:
AfghanistanAlbaniaAlgeriaAngolaArab WorldArgentinaArmeniaAustraliaAustriaAzerbaijanBahamas, TheBahrainBangladeshBarbadosBelarusBelgiumBelizeBeninBhutanBoliviaBotswanaBrazilBulgariaBurkina FasoBurundiCabo VerdeCambodiaCameroonCanadaCaribbean small statesCentral African RepublicCentral Europe and the BalticsChadChileChinaColombiaComorosCongo, Dem. Rep.Congo, Rep.Costa RicaCote d'IvoireCroatiaCubaCyprusCzech RepublicDenmarkDominicaDominican RepublicEarly-demographic dividendEast Asia & PacificEast Asia & Pacific (excluding high income)East Asia & Pacific (IDA & IBRD countries)EcuadorEgypt, Arab Rep.El SalvadorEritreaEstoniaEthiopiaEuro areaEurope & Central AsiaEurope & Central Asia (excluding high income)Europe & Central Asia (IDA & IBRD countries)European UnionFijiFinlandFragile and conflict affected situationsFranceGabonGambia, TheGeorgiaGermanyGhanaGreeceGuatemalaGuineaGuinea-BissauGuyanaHaitiHeavily indebted poor countries (HIPC)High incomeHondurasHungaryIBRD onlyIDA & IBRD totalIDA blendIDA onlyIDA totalIndiaIndonesiaIran, Islamic Rep.IraqIrelandIsraelItalyJamaicaJapanJordanKazakhstanKenyaKiribatiKorea, Rep.KuwaitKyrgyz RepublicLao PDRLate-demographic dividendLatin America & Caribbean Latin America & Caribbean (excluding high income)Latin America & the Caribbean (IDA & IBRD countries)LatviaLeast developed countries: UN classificationLebanonLesothoLiberiaLibyaLithuaniaLow & middle incomeLow incomeLower middle incomeLuxembourgMacedonia, FYRMadagascarMalawiMalaysiaMaldivesMaliMauritaniaMauritiusMexicoMiddle East & North AfricaMiddle East & North Africa (excluding high income)Middle East & North Africa (IDA & IBRD countries)Middle incomeMoldovaMongoliaMoroccoMozambiqueNamibiaNepalNetherlandsNew ZealandNicaraguaNigerNigeriaNorth AmericaNorwayOECD membersOmanOther small statesPacific island small statesPakistanPanamaPapua New GuineaParaguayPeruPhilippinesPolandPortugalPost-demographic dividendPre-demographic dividendQatarRomaniaRussian FederationRwandaSamoaSao Tome and PrincipeSaudi ArabiaSenegalSeychellesSierra LeoneSingaporeSlovak RepublicSloveniaSmall statesSolomon IslandsSouth AfricaSouth AsiaSouth Asia (IDA & IBRD)SpainSri LankaSt. LuciaSt. Vincent and the GrenadinesSub-Saharan Africa Sub-Saharan Africa (excluding high income)Sub-Saharan Africa (IDA & IBRD countries)SurinameSwazilandSwedenSwitzerlandTajikistanTanzaniaThailandTogoTongaTrinidad and TobagoTunisiaTurkeyTurkmenistanUgandaUkraineUnited Arab EmiratesUnited KingdomUnited StatesUpper middle incomeUruguayUzbekistanVanuatuVenezuela, RBVietnamWorldYemen, Rep.ZambiaZimbabwe Timeline:
This timeline shows a graph from 1971 to 2015 of Indonesia. No data until 1970. Number of actual observations by date: 45.
Source name:
World Development Indicators
Source organization:
World Bank staff estimates based on sources and methods in World Bank's "The Changing Wealth of Nations: Measuring Sustainable Development in the New Millennium" (2011).
Categories, topics:
Economy & Growth
Last updated:
apr 23, 2017
Indicators value changes by year
Minimum:
60.464 bln
jan 1, 1971
Maximum:
828.169 bln
jan 1, 2015
At the date of observation
Value
Absolute change
Change from previous value
jan 1, 1971
60.464 bln
+60.464 bln
0.0%
jan 1, 1972
64.317 bln
+3.853 bln
6.37%
jan 1, 1973
67.365 bln
+3.048 bln
4.74%
jan 1, 1974
73.159 bln
+5.794 bln
8.6%
jan 1, 1975
80.496 bln
+7.337 bln
10.03%
jan 1, 1976
86.66 bln
+6.163 bln
7.66%
jan 1, 1977
90.559 bln
+3.899 bln
4.5%
jan 1, 1978
99.039 bln
+8.481 bln
9.36%
jan 1, 1979
110.001 bln
+10.962 bln
11.07%
jan 1, 1980
104.765 bln
-5.236 bln
-4.76%
jan 1, 1981
133.157 bln
+28.392 bln
27.1%
jan 1, 1982
156.71 bln
+23.553 bln
17.69%
jan 1, 1983
156.863 bln
+152.369 mln
0.1%
jan 1, 1984
167.416 bln
+10.553 bln
6.73%
jan 1, 1985
173.358 bln
+5.942 bln
3.55%
jan 1, 1986
185.174 bln
+11.815 bln
6.82%
jan 1, 1987
193.809 bln
+8.635 bln
4.66%
jan 1, 1988
199.163 bln
+5.354 bln
2.76%
jan 1, 1989
226.463 bln
+27.3 bln
13.71%
jan 1, 1990
249.978 bln
+23.515 bln
10.38%
jan 1, 1991
272.406 bln
+22.428 bln
8.97%
jan 1, 1992
274.602 bln
+2.196 bln
0.81%
jan 1, 1993
300.128 bln
+25.526 bln
9.3%
jan 1, 1994
330.829 bln
+30.701 bln
10.23%
jan 1, 1995
361.282 bln
+30.453 bln
9.21%
jan 1, 1996
390.183 bln
+28.901 bln
8.0%
jan 1, 1997
420.999 bln
+30.816 bln
7.9%
jan 1, 1998
449.013 bln
+28.015 bln
6.65%
jan 1, 1999
398.619 bln
-50.395 bln
-11.22%
jan 1, 2000
380.087 bln
-18.532 bln
-4.65%
jan 1, 2001
382.371 bln
+2.284 bln
0.6%
jan 1, 2002
389.012 bln
+6.641 bln
1.74%
jan 1, 2003
398.568 bln
+9.556 bln
2.46%
jan 1, 2004
459.292 bln
+60.724 bln
15.24%
jan 1, 2005
468.088 bln
+8.796 bln
1.92%
jan 1, 2006
475.846 bln
+7.757 bln
1.66%
jan 1, 2007
518.822 bln
+42.977 bln
9.03%
jan 1, 2008
546.571 bln
+27.748 bln
5.35%
jan 1, 2009
559.583 bln
+13.012 bln
2.38%
jan 1, 2010
621.706 bln
+62.122 bln
11.1%
jan 1, 2011
661.604 bln
+39.898 bln
6.42%
jan 1, 2012
700.976 bln
+39.372 bln
5.95%
jan 1, 2013
744.451 bln
+43.475 bln
6.2%
jan 1, 2014
778.241 bln
+33.79 bln
4.54%
jan 1, 2015
828.169 bln
+49.928 bln
6.42%
Ranking of countries by current statistics by years


Comments: