29
/
en
AIzaSyAYiBZKx7MnpbEhh9jyipgxe19OcubqV5w
April 1, 2024
100788
Canada
CAN
true
2
1
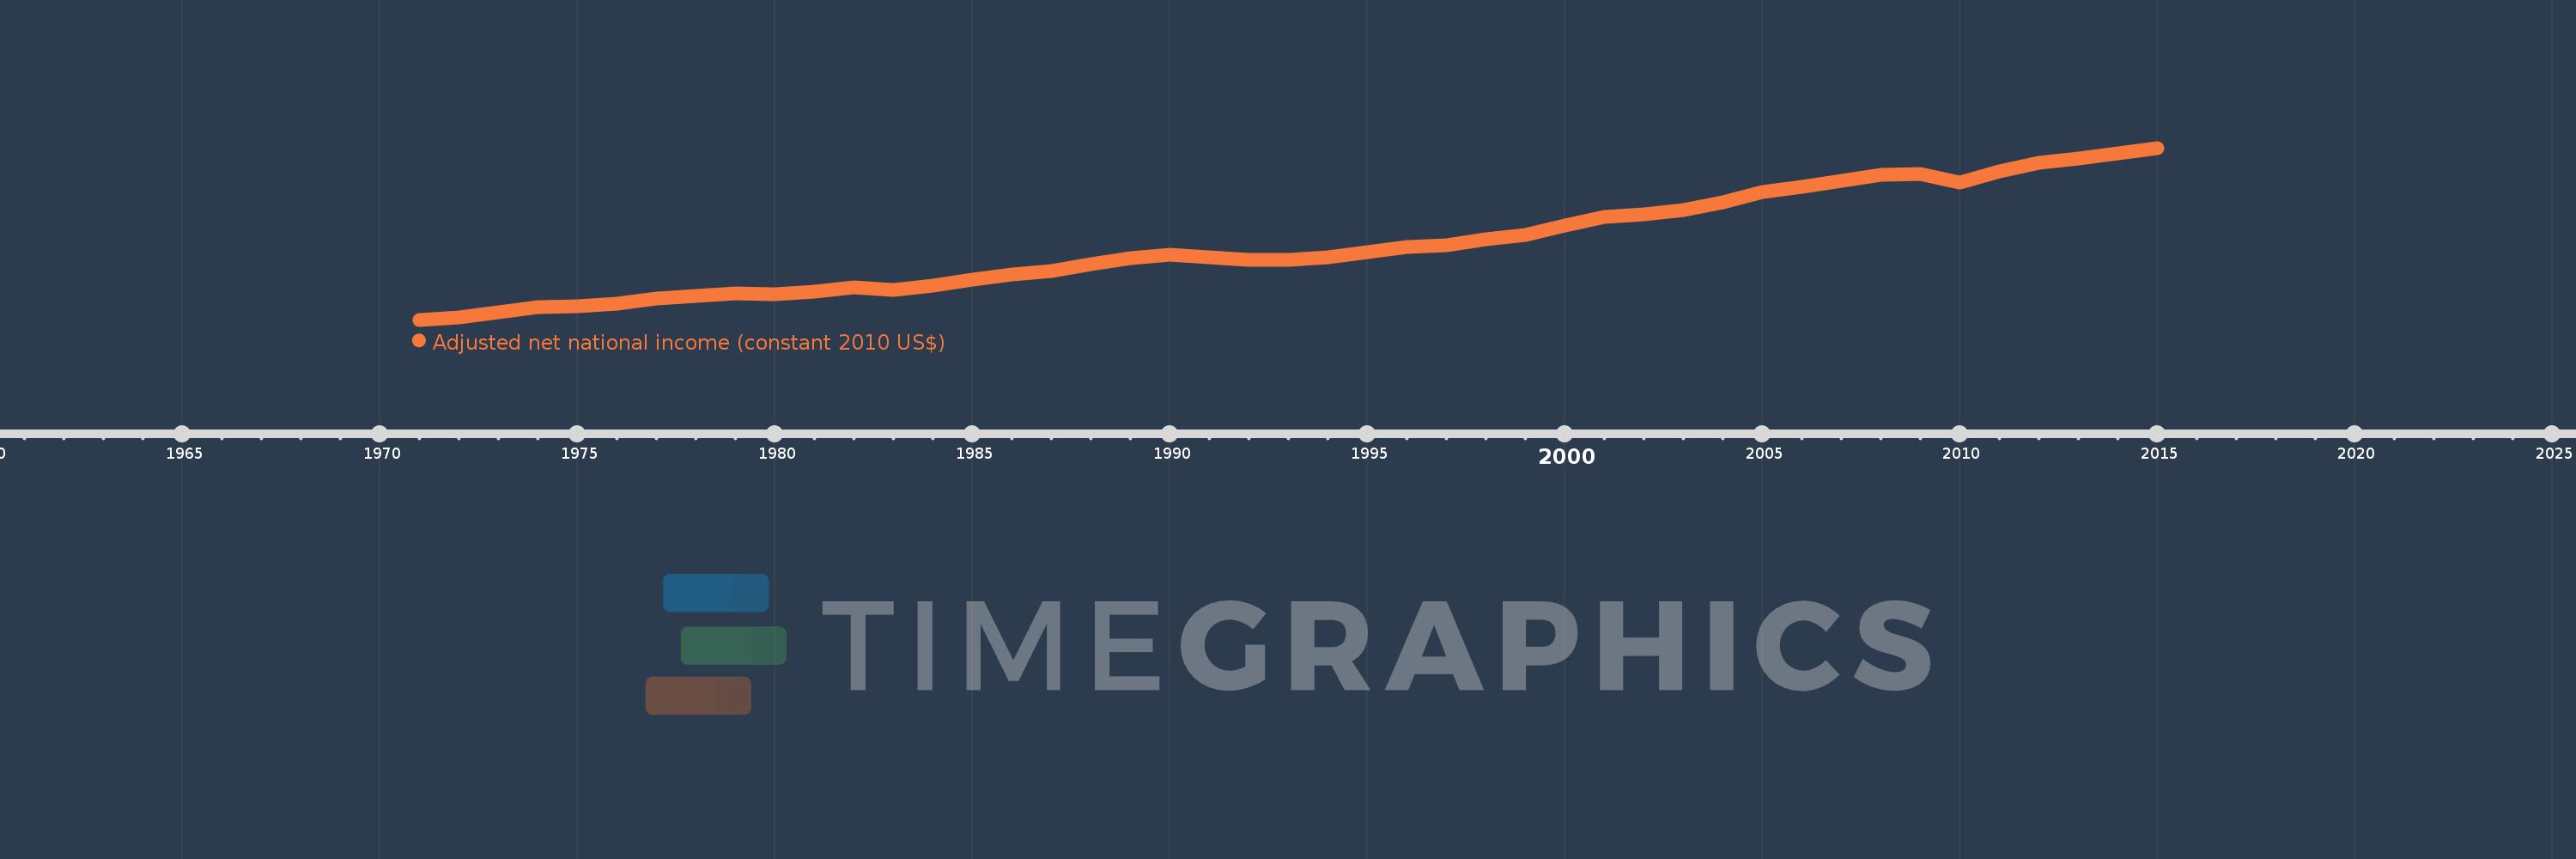
Adjusted net national income (constant 2010 US$)
2015,2014,2013,2012,2011,2010,2009,2008,2007,2006,2005,2004,2003,2002,2001,2000,1999,1998,1997,1996,1995,1994,1993,1992,1991,1990,1989,1988,1987,1986,1985,1984,1983,1982,1981,1980,1979,1978,1977,1976,1975,1974,1973,1972,1971
This statistics in other country:
AfghanistanAlbaniaAlgeriaAngolaArab WorldArgentinaArmeniaAustraliaAustriaAzerbaijanBahamas, TheBahrainBangladeshBarbadosBelarusBelgiumBelizeBeninBhutanBoliviaBotswanaBrazilBulgariaBurkina FasoBurundiCabo VerdeCambodiaCameroonCanadaCaribbean small statesCentral African RepublicCentral Europe and the BalticsChadChileChinaColombiaComorosCongo, Dem. Rep.Congo, Rep.Costa RicaCote d'IvoireCroatiaCubaCyprusCzech RepublicDenmarkDominicaDominican RepublicEarly-demographic dividendEast Asia & PacificEast Asia & Pacific (excluding high income)East Asia & Pacific (IDA & IBRD countries)EcuadorEgypt, Arab Rep.El SalvadorEritreaEstoniaEthiopiaEuro areaEurope & Central AsiaEurope & Central Asia (excluding high income)Europe & Central Asia (IDA & IBRD countries)European UnionFijiFinlandFragile and conflict affected situationsFranceGabonGambia, TheGeorgiaGermanyGhanaGreeceGuatemalaGuineaGuinea-BissauGuyanaHaitiHeavily indebted poor countries (HIPC)High incomeHondurasHungaryIBRD onlyIDA & IBRD totalIDA blendIDA onlyIDA totalIndiaIndonesiaIran, Islamic Rep.IraqIrelandIsraelItalyJamaicaJapanJordanKazakhstanKenyaKiribatiKorea, Rep.KuwaitKyrgyz RepublicLao PDRLate-demographic dividendLatin America & Caribbean Latin America & Caribbean (excluding high income)Latin America & the Caribbean (IDA & IBRD countries)LatviaLeast developed countries: UN classificationLebanonLesothoLiberiaLibyaLithuaniaLow & middle incomeLow incomeLower middle incomeLuxembourgMacedonia, FYRMadagascarMalawiMalaysiaMaldivesMaliMauritaniaMauritiusMexicoMiddle East & North AfricaMiddle East & North Africa (excluding high income)Middle East & North Africa (IDA & IBRD countries)Middle incomeMoldovaMongoliaMoroccoMozambiqueNamibiaNepalNetherlandsNew ZealandNicaraguaNigerNigeriaNorth AmericaNorwayOECD membersOmanOther small statesPacific island small statesPakistanPanamaPapua New GuineaParaguayPeruPhilippinesPolandPortugalPost-demographic dividendPre-demographic dividendQatarRomaniaRussian FederationRwandaSamoaSao Tome and PrincipeSaudi ArabiaSenegalSeychellesSierra LeoneSingaporeSlovak RepublicSloveniaSmall statesSolomon IslandsSouth AfricaSouth AsiaSouth Asia (IDA & IBRD)SpainSri LankaSt. LuciaSt. Vincent and the GrenadinesSub-Saharan Africa Sub-Saharan Africa (excluding high income)Sub-Saharan Africa (IDA & IBRD countries)SurinameSwazilandSwedenSwitzerlandTajikistanTanzaniaThailandTogoTongaTrinidad and TobagoTunisiaTurkeyTurkmenistanUgandaUkraineUnited Arab EmiratesUnited KingdomUnited StatesUpper middle incomeUruguayUzbekistanVanuatuVenezuela, RBVietnamWorldYemen, Rep.ZambiaZimbabwe Timeline:
This timeline shows a graph from 1971 to 2015 of Canada. No data until 1970. Number of actual observations by date: 45.
Source name:
World Development Indicators
Source organization:
World Bank staff estimates based on sources and methods in World Bank's "The Changing Wealth of Nations: Measuring Sustainable Development in the New Millennium" (2011).
Categories, topics:
Economy & Growth
Last updated:
apr 23, 2017
Indicators value changes by year
Minimum:
424.816 bln
jan 1, 1971
Maximum:
1.411 trl
jan 1, 2015
At the date of observation
Value
Absolute change
Change from previous value
jan 1, 1971
424.816 bln
+424.816 bln
0.0%
jan 1, 1972
440.189 bln
+15.373 bln
3.62%
jan 1, 1973
466.408 bln
+26.218 bln
5.96%
jan 1, 1974
497.189 bln
+30.782 bln
6.6%
jan 1, 1975
502.437 bln
+5.248 bln
1.06%
jan 1, 1976
515.219 bln
+12.782 bln
2.54%
jan 1, 1977
548.649 bln
+33.429 bln
6.49%
jan 1, 1978
561.42 bln
+12.771 bln
2.33%
jan 1, 1979
578.246 bln
+16.826 bln
3.0%
jan 1, 1980
570.685 bln
-7.561 bln
-1.31%
jan 1, 1981
588.517 bln
+17.832 bln
3.12%
jan 1, 1982
611.665 bln
+23.148 bln
3.93%
jan 1, 1983
595.504 bln
-16.161 bln
-2.64%
jan 1, 1984
622.17 bln
+26.666 bln
4.48%
jan 1, 1985
654.766 bln
+32.596 bln
5.24%
jan 1, 1986
686.772 bln
+32.006 bln
4.89%
jan 1, 1987
706.092 bln
+19.32 bln
2.81%
jan 1, 1988
743.296 bln
+37.204 bln
5.27%
jan 1, 1989
779.906 bln
+36.61 bln
4.93%
jan 1, 1990
796.78 bln
+16.875 bln
2.16%
jan 1, 1991
783.332 bln
-13.448 bln
-1.69%
jan 1, 1992
768.469 bln
-14.863 bln
-1.9%
jan 1, 1993
767.539 bln
-930.45 mln
-0.12%
jan 1, 1994
782.918 bln
+15.379 bln
2.0%
jan 1, 1995
814.938 bln
+32.02 bln
4.09%
jan 1, 1996
843.515 bln
+28.577 bln
3.51%
jan 1, 1997
853.476 bln
+9.962 bln
1.18%
jan 1, 1998
885.922 bln
+32.445 bln
3.8%
jan 1, 1999
912.385 bln
+26.463 bln
2.99%
jan 1, 2000
966.118 bln
+53.733 bln
5.89%
jan 1, 2001
1.015 trl
+49.04 bln
5.08%
jan 1, 2002
1.029 trl
+13.353 bln
1.32%
jan 1, 2003
1.057 trl
+28.063 bln
2.73%
jan 1, 2004
1.101 trl
+44.103 bln
4.17%
jan 1, 2005
1.156 trl
+55.455 bln
5.04%
jan 1, 2006
1.188 trl
+32.32 bln
2.8%
jan 1, 2007
1.223 trl
+34.84 bln
2.93%
jan 1, 2008
1.256 trl
+33.116 bln
2.71%
jan 1, 2009
1.262 trl
+5.386 bln
0.43%
jan 1, 2010
1.211 trl
-50.583 bln
-4.01%
jan 1, 2011
1.276 trl
+65.004 bln
5.37%
jan 1, 2012
1.328 trl
+51.434 bln
4.03%
jan 1, 2013
1.352 trl
+24.753 bln
1.86%
jan 1, 2014
1.379 trl
+26.481 bln
1.96%
jan 1, 2015
1.411 trl
+32.317 bln
2.34%
Ranking of countries by current statistics by years


Comments: