29
/
en
AIzaSyAYiBZKx7MnpbEhh9jyipgxe19OcubqV5w
April 1, 2024
161151
Italy
ITA
true
2
1
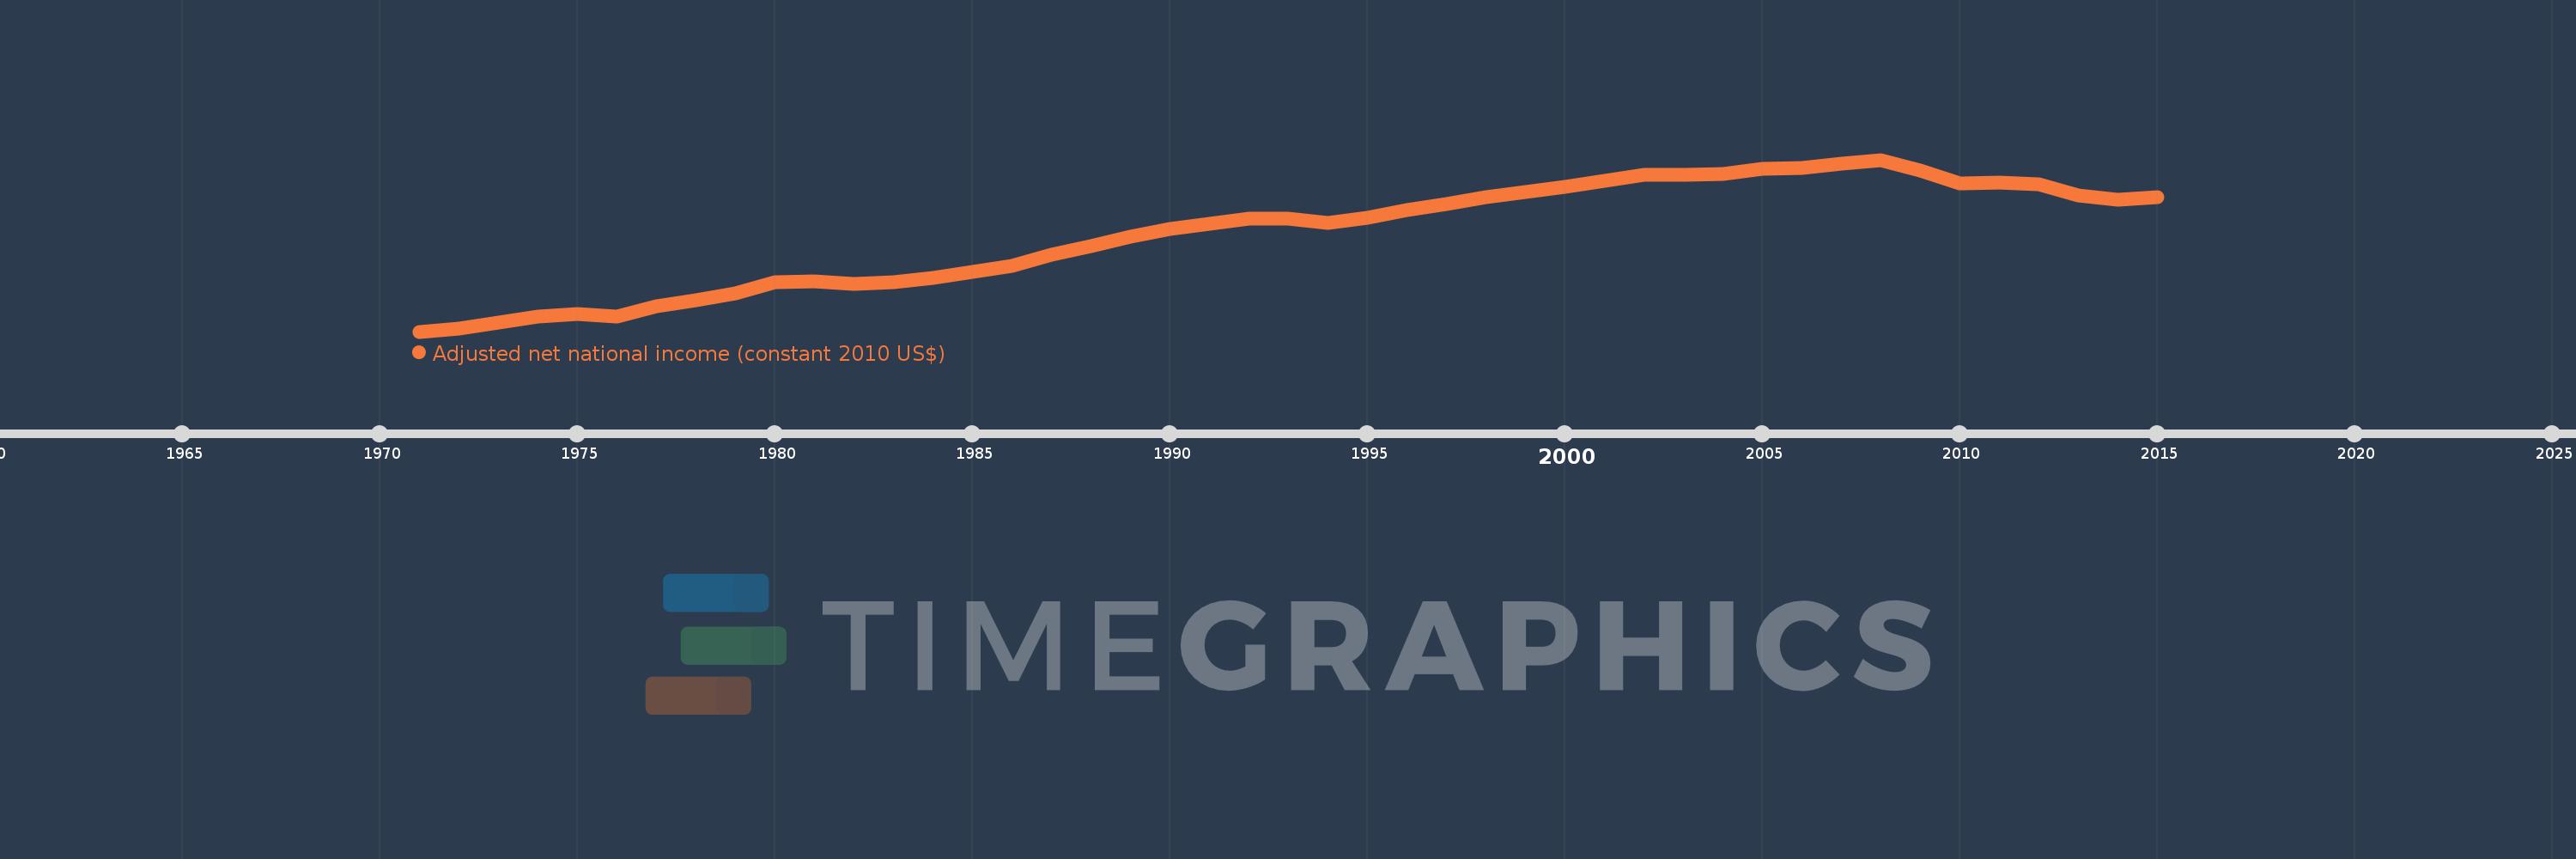
Adjusted net national income (constant 2010 US$)
2015,2014,2013,2012,2011,2010,2009,2008,2007,2006,2005,2004,2003,2002,2001,2000,1999,1998,1997,1996,1995,1994,1993,1992,1991,1990,1989,1988,1987,1986,1985,1984,1983,1982,1981,1980,1979,1978,1977,1976,1975,1974,1973,1972,1971
This statistics in other country:
AfghanistanAlbaniaAlgeriaAngolaArab WorldArgentinaArmeniaAustraliaAustriaAzerbaijanBahamas, TheBahrainBangladeshBarbadosBelarusBelgiumBelizeBeninBhutanBoliviaBotswanaBrazilBulgariaBurkina FasoBurundiCabo VerdeCambodiaCameroonCanadaCaribbean small statesCentral African RepublicCentral Europe and the BalticsChadChileChinaColombiaComorosCongo, Dem. Rep.Congo, Rep.Costa RicaCote d'IvoireCroatiaCubaCyprusCzech RepublicDenmarkDominicaDominican RepublicEarly-demographic dividendEast Asia & PacificEast Asia & Pacific (excluding high income)East Asia & Pacific (IDA & IBRD countries)EcuadorEgypt, Arab Rep.El SalvadorEritreaEstoniaEthiopiaEuro areaEurope & Central AsiaEurope & Central Asia (excluding high income)Europe & Central Asia (IDA & IBRD countries)European UnionFijiFinlandFragile and conflict affected situationsFranceGabonGambia, TheGeorgiaGermanyGhanaGreeceGuatemalaGuineaGuinea-BissauGuyanaHaitiHeavily indebted poor countries (HIPC)High incomeHondurasHungaryIBRD onlyIDA & IBRD totalIDA blendIDA onlyIDA totalIndiaIndonesiaIran, Islamic Rep.IraqIrelandIsraelItalyJamaicaJapanJordanKazakhstanKenyaKiribatiKorea, Rep.KuwaitKyrgyz RepublicLao PDRLate-demographic dividendLatin America & Caribbean Latin America & Caribbean (excluding high income)Latin America & the Caribbean (IDA & IBRD countries)LatviaLeast developed countries: UN classificationLebanonLesothoLiberiaLibyaLithuaniaLow & middle incomeLow incomeLower middle incomeLuxembourgMacedonia, FYRMadagascarMalawiMalaysiaMaldivesMaliMauritaniaMauritiusMexicoMiddle East & North AfricaMiddle East & North Africa (excluding high income)Middle East & North Africa (IDA & IBRD countries)Middle incomeMoldovaMongoliaMoroccoMozambiqueNamibiaNepalNetherlandsNew ZealandNicaraguaNigerNigeriaNorth AmericaNorwayOECD membersOmanOther small statesPacific island small statesPakistanPanamaPapua New GuineaParaguayPeruPhilippinesPolandPortugalPost-demographic dividendPre-demographic dividendQatarRomaniaRussian FederationRwandaSamoaSao Tome and PrincipeSaudi ArabiaSenegalSeychellesSierra LeoneSingaporeSlovak RepublicSloveniaSmall statesSolomon IslandsSouth AfricaSouth AsiaSouth Asia (IDA & IBRD)SpainSri LankaSt. LuciaSt. Vincent and the GrenadinesSub-Saharan Africa Sub-Saharan Africa (excluding high income)Sub-Saharan Africa (IDA & IBRD countries)SurinameSwazilandSwedenSwitzerlandTajikistanTanzaniaThailandTogoTongaTrinidad and TobagoTunisiaTurkeyTurkmenistanUgandaUkraineUnited Arab EmiratesUnited KingdomUnited StatesUpper middle incomeUruguayUzbekistanVanuatuVenezuela, RBVietnamWorldYemen, Rep.ZambiaZimbabwe Timeline:
This timeline shows a graph from 1971 to 2015 of Italy. No data until 1970. Number of actual observations by date: 45.
Source name:
World Development Indicators
Source organization:
World Bank staff estimates based on sources and methods in World Bank's "The Changing Wealth of Nations: Measuring Sustainable Development in the New Millennium" (2011).
Categories, topics:
Economy & Growth
Last updated:
apr 23, 2017
Indicators value changes by year
Minimum:
865.918 bln
jan 1, 1971
Maximum:
1.882 trl
jan 1, 2008
At the date of observation
Value
Absolute change
Change from previous value
jan 1, 1971
865.918 bln
+865.918 bln
0.0%
jan 1, 1972
883.652 bln
+17.734 bln
2.05%
jan 1, 1973
918.792 bln
+35.14 bln
3.98%
jan 1, 1974
957.1 bln
+38.308 bln
4.17%
jan 1, 1975
970.121 bln
+13.021 bln
1.36%
jan 1, 1976
953.983 bln
-16.138 bln
-1.66%
jan 1, 1977
1.015 trl
+60.677 bln
6.36%
jan 1, 1978
1.05 trl
+35.621 bln
3.51%
jan 1, 1979
1.093 trl
+43.056 bln
4.1%
jan 1, 1980
1.16 trl
+66.926 bln
6.12%
jan 1, 1981
1.165 trl
+5.074 bln
0.44%
jan 1, 1982
1.148 trl
-17.24 bln
-1.48%
jan 1, 1983
1.158 trl
+9.888 bln
0.86%
jan 1, 1984
1.186 trl
+27.929 bln
2.41%
jan 1, 1985
1.221 trl
+35.156 bln
2.96%
jan 1, 1986
1.253 trl
+32.068 bln
2.63%
jan 1, 1987
1.32 trl
+66.868 bln
5.34%
jan 1, 1988
1.371 trl
+51.08 bln
3.87%
jan 1, 1989
1.429 trl
+57.535 bln
4.2%
jan 1, 1990
1.473 trl
+44.291 bln
3.1%
jan 1, 1991
1.503 trl
+30.432 bln
2.07%
jan 1, 1992
1.531 trl
+28.052 bln
1.87%
jan 1, 1993
1.535 trl
+3.481 bln
0.23%
jan 1, 1994
1.509 trl
-26.031 bln
-1.7%
jan 1, 1995
1.538 trl
+28.74 bln
1.9%
jan 1, 1996
1.587 trl
+49.387 bln
3.21%
jan 1, 1997
1.621 trl
+34.079 bln
2.15%
jan 1, 1998
1.66 trl
+38.832 bln
2.4%
jan 1, 1999
1.693 trl
+33.061 bln
1.99%
jan 1, 2000
1.722 trl
+29.231 bln
1.73%
jan 1, 2001
1.755 trl
+32.817 bln
1.91%
jan 1, 2002
1.792 trl
+37.339 bln
2.13%
jan 1, 2003
1.793 trl
+636.629 mln
0.04%
jan 1, 2004
1.799 trl
+6.481 bln
0.36%
jan 1, 2005
1.829 trl
+29.819 bln
1.66%
jan 1, 2006
1.832 trl
+2.75 bln
0.15%
jan 1, 2007
1.858 trl
+25.68 bln
1.4%
jan 1, 2008
1.882 trl
+24.098 bln
1.3%
jan 1, 2009
1.817 trl
-64.301 bln
-3.42%
jan 1, 2010
1.745 trl
-72.984 bln
-4.02%
jan 1, 2011
1.748 trl
+3.115 bln
0.18%
jan 1, 2012
1.737 trl
-10.141 bln
-0.58%
jan 1, 2013
1.673 trl
-64.058 bln
-3.69%
jan 1, 2014
1.648 trl
-25.437 bln
-1.52%
jan 1, 2015
1.66 trl
+11.681 bln
0.71%
Ranking of countries by current statistics by years


Comments: