29
/
en
AIzaSyAYiBZKx7MnpbEhh9jyipgxe19OcubqV5w
April 1, 2024
111807
Costa Rica
CRI
true
2
1
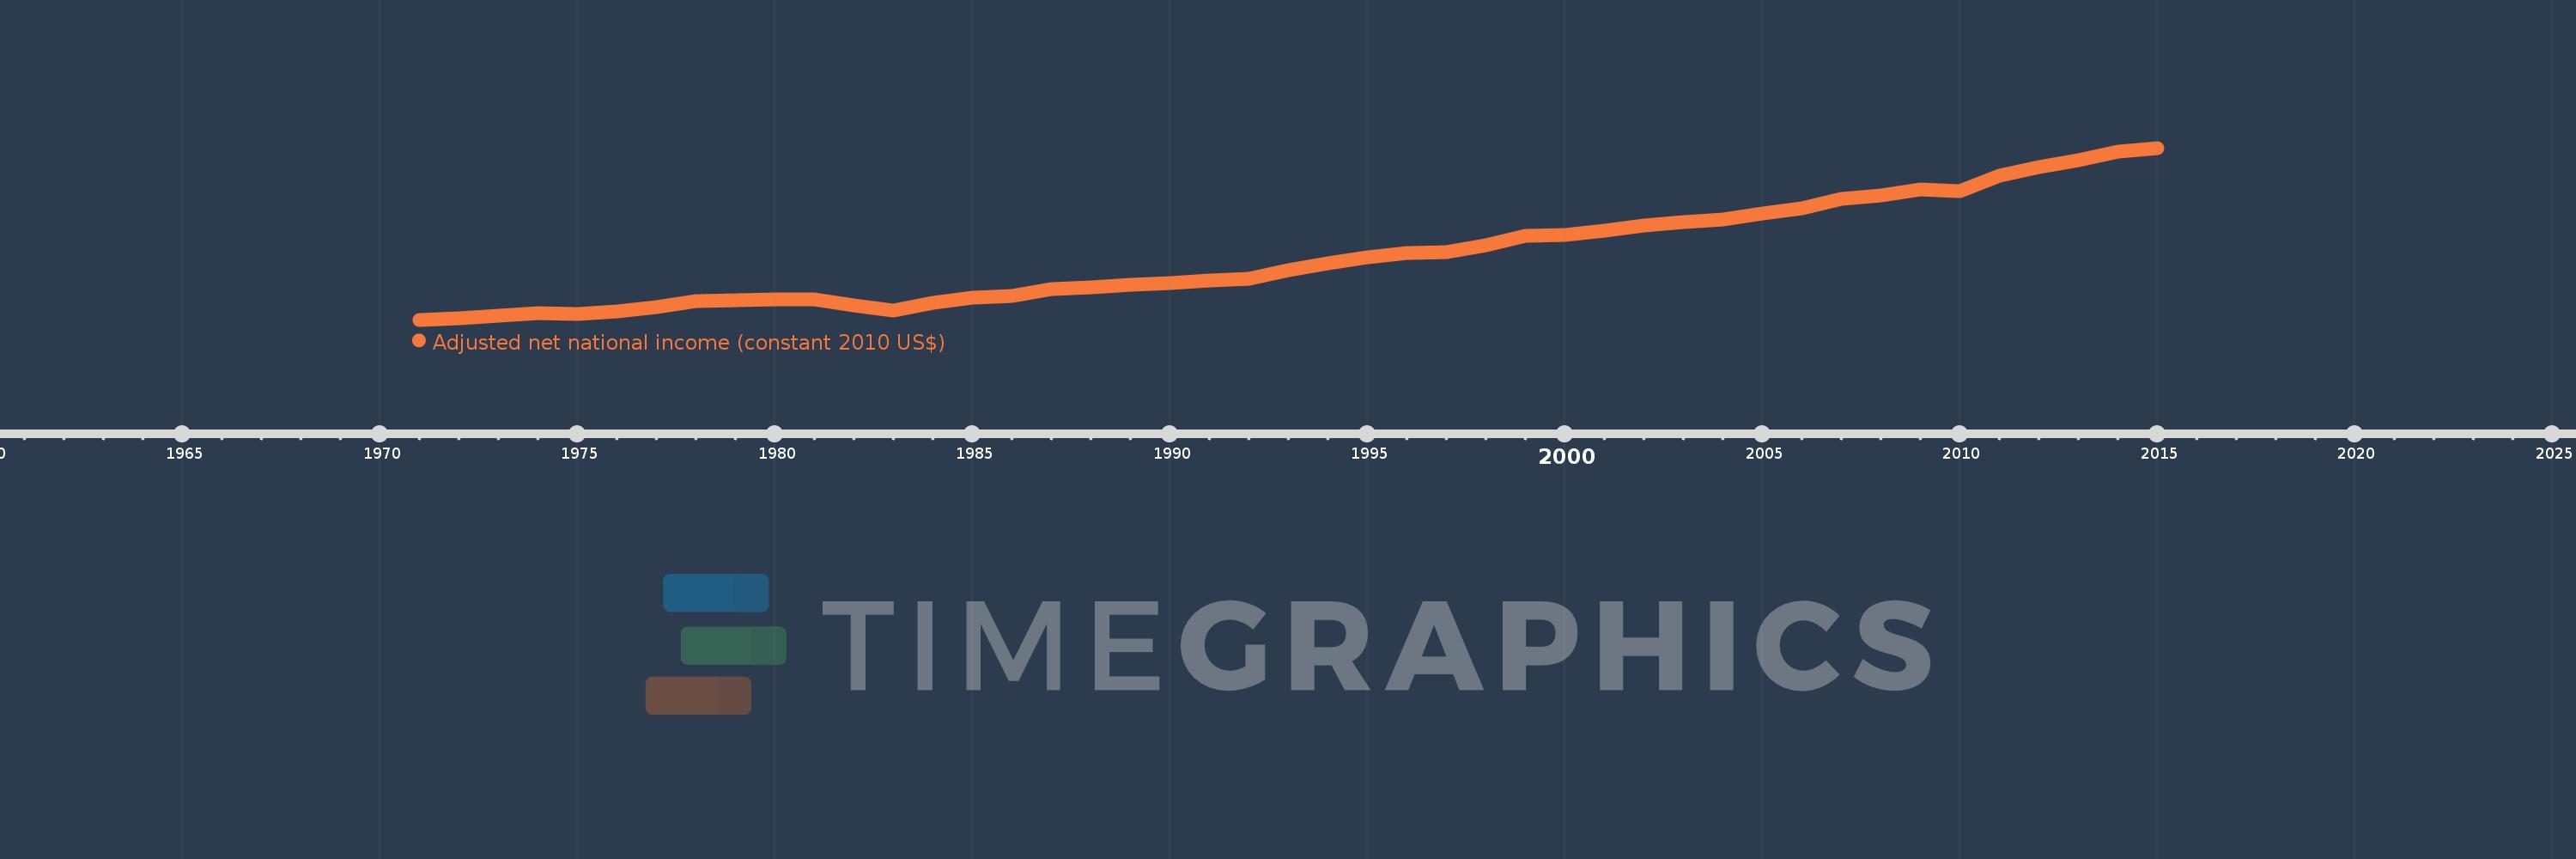
Adjusted net national income (constant 2010 US$)
2015,2014,2013,2012,2011,2010,2009,2008,2007,2006,2005,2004,2003,2002,2001,2000,1999,1998,1997,1996,1995,1994,1993,1992,1991,1990,1989,1988,1987,1986,1985,1984,1983,1982,1981,1980,1979,1978,1977,1976,1975,1974,1973,1972,1971
This statistics in other country:
AfghanistanAlbaniaAlgeriaAngolaArab WorldArgentinaArmeniaAustraliaAustriaAzerbaijanBahamas, TheBahrainBangladeshBarbadosBelarusBelgiumBelizeBeninBhutanBoliviaBotswanaBrazilBulgariaBurkina FasoBurundiCabo VerdeCambodiaCameroonCanadaCaribbean small statesCentral African RepublicCentral Europe and the BalticsChadChileChinaColombiaComorosCongo, Dem. Rep.Congo, Rep.Costa RicaCote d'IvoireCroatiaCubaCyprusCzech RepublicDenmarkDominicaDominican RepublicEarly-demographic dividendEast Asia & PacificEast Asia & Pacific (excluding high income)East Asia & Pacific (IDA & IBRD countries)EcuadorEgypt, Arab Rep.El SalvadorEritreaEstoniaEthiopiaEuro areaEurope & Central AsiaEurope & Central Asia (excluding high income)Europe & Central Asia (IDA & IBRD countries)European UnionFijiFinlandFragile and conflict affected situationsFranceGabonGambia, TheGeorgiaGermanyGhanaGreeceGuatemalaGuineaGuinea-BissauGuyanaHaitiHeavily indebted poor countries (HIPC)High incomeHondurasHungaryIBRD onlyIDA & IBRD totalIDA blendIDA onlyIDA totalIndiaIndonesiaIran, Islamic Rep.IraqIrelandIsraelItalyJamaicaJapanJordanKazakhstanKenyaKiribatiKorea, Rep.KuwaitKyrgyz RepublicLao PDRLate-demographic dividendLatin America & Caribbean Latin America & Caribbean (excluding high income)Latin America & the Caribbean (IDA & IBRD countries)LatviaLeast developed countries: UN classificationLebanonLesothoLiberiaLibyaLithuaniaLow & middle incomeLow incomeLower middle incomeLuxembourgMacedonia, FYRMadagascarMalawiMalaysiaMaldivesMaliMauritaniaMauritiusMexicoMiddle East & North AfricaMiddle East & North Africa (excluding high income)Middle East & North Africa (IDA & IBRD countries)Middle incomeMoldovaMongoliaMoroccoMozambiqueNamibiaNepalNetherlandsNew ZealandNicaraguaNigerNigeriaNorth AmericaNorwayOECD membersOmanOther small statesPacific island small statesPakistanPanamaPapua New GuineaParaguayPeruPhilippinesPolandPortugalPost-demographic dividendPre-demographic dividendQatarRomaniaRussian FederationRwandaSamoaSao Tome and PrincipeSaudi ArabiaSenegalSeychellesSierra LeoneSingaporeSlovak RepublicSloveniaSmall statesSolomon IslandsSouth AfricaSouth AsiaSouth Asia (IDA & IBRD)SpainSri LankaSt. LuciaSt. Vincent and the GrenadinesSub-Saharan Africa Sub-Saharan Africa (excluding high income)Sub-Saharan Africa (IDA & IBRD countries)SurinameSwazilandSwedenSwitzerlandTajikistanTanzaniaThailandTogoTongaTrinidad and TobagoTunisiaTurkeyTurkmenistanUgandaUkraineUnited Arab EmiratesUnited KingdomUnited StatesUpper middle incomeUruguayUzbekistanVanuatuVenezuela, RBVietnamWorldYemen, Rep.ZambiaZimbabwe Timeline:
This timeline shows a graph from 1971 to 2015 of Costa Rica. No data until 1970. Number of actual observations by date: 45.
Source name:
World Development Indicators
Source organization:
World Bank staff estimates based on sources and methods in World Bank's "The Changing Wealth of Nations: Measuring Sustainable Development in the New Millennium" (2011).
Categories, topics:
Economy & Growth
Last updated:
apr 23, 2017
Indicators value changes by year
Minimum:
5.968 bln
jan 1, 1971
Maximum:
38.264 bln
jan 1, 2015
At the date of observation
Value
Absolute change
Change from previous value
jan 1, 1971
5.968 bln
+5.968 bln
0.0%
jan 1, 1972
6.182 bln
+214.498 mln
3.59%
jan 1, 1973
6.657 bln
+474.394 mln
7.67%
jan 1, 1974
7.21 bln
+553.307 mln
8.31%
jan 1, 1975
7.106 bln
-103.858 mln
-1.44%
jan 1, 1976
7.486 bln
+380.074 mln
5.35%
jan 1, 1977
8.301 bln
+814.797 mln
10.88%
jan 1, 1978
9.394 bln
+1.092 bln
13.16%
jan 1, 1979
9.678 bln
+284.898 mln
3.03%
jan 1, 1980
9.854 bln
+175.514 mln
1.81%
jan 1, 1981
9.826 bln
-27.899 mln
-0.28%
jan 1, 1982
8.636 bln
-1.19 bln
-12.11%
jan 1, 1983
7.696 bln
-940.839 mln
-10.89%
jan 1, 1984
9.154 bln
+1.458 bln
18.95%
jan 1, 1985
10.156 bln
+1.002 bln
10.94%
jan 1, 1986
10.431 bln
+275.183 mln
2.71%
jan 1, 1987
11.701 bln
+1.271 bln
12.18%
jan 1, 1988
12.035 bln
+333.953 mln
2.85%
jan 1, 1989
12.467 bln
+431.842 mln
3.59%
jan 1, 1990
12.904 bln
+437.024 mln
3.51%
jan 1, 1991
13.29 bln
+385.928 mln
2.99%
jan 1, 1992
13.639 bln
+348.77 mln
2.62%
jan 1, 1993
15.301 bln
+1.662 bln
12.19%
jan 1, 1994
16.543 bln
+1.241 bln
8.11%
jan 1, 1995
17.719 bln
+1.177 bln
7.11%
jan 1, 1996
18.522 bln
+802.806 mln
4.53%
jan 1, 1997
18.651 bln
+129.019 mln
0.7%
jan 1, 1998
20.008 bln
+1.356 bln
7.27%
jan 1, 1999
21.799 bln
+1.791 bln
8.95%
jan 1, 2000
21.942 bln
+143.154 mln
0.66%
jan 1, 2001
22.697 bln
+755.747 mln
3.44%
jan 1, 2002
23.691 bln
+993.226 mln
4.38%
jan 1, 2003
24.36 bln
+669.761 mln
2.83%
jan 1, 2004
24.765 bln
+405.025 mln
1.66%
jan 1, 2005
25.892 bln
+1.126 bln
4.55%
jan 1, 2006
26.886 bln
+993.918 mln
3.84%
jan 1, 2007
28.739 bln
+1.853 bln
6.89%
jan 1, 2008
29.293 bln
+554.05 mln
1.93%
jan 1, 2009
30.475 bln
+1.182 bln
4.04%
jan 1, 2010
30.158 bln
-316.989 mln
-1.04%
jan 1, 2011
32.995 bln
+2.837 bln
9.41%
jan 1, 2012
34.626 bln
+1.631 bln
4.94%
jan 1, 2013
36.014 bln
+1.388 bln
4.01%
jan 1, 2014
37.493 bln
+1.479 bln
4.11%
jan 1, 2015
38.264 bln
+771.086 mln
2.06%
Ranking of countries by current statistics by years


Comments: