29
/
en
AIzaSyAYiBZKx7MnpbEhh9jyipgxe19OcubqV5w
April 1, 2024
124394
Egypt, Arab Rep.
EGY
true
2
1
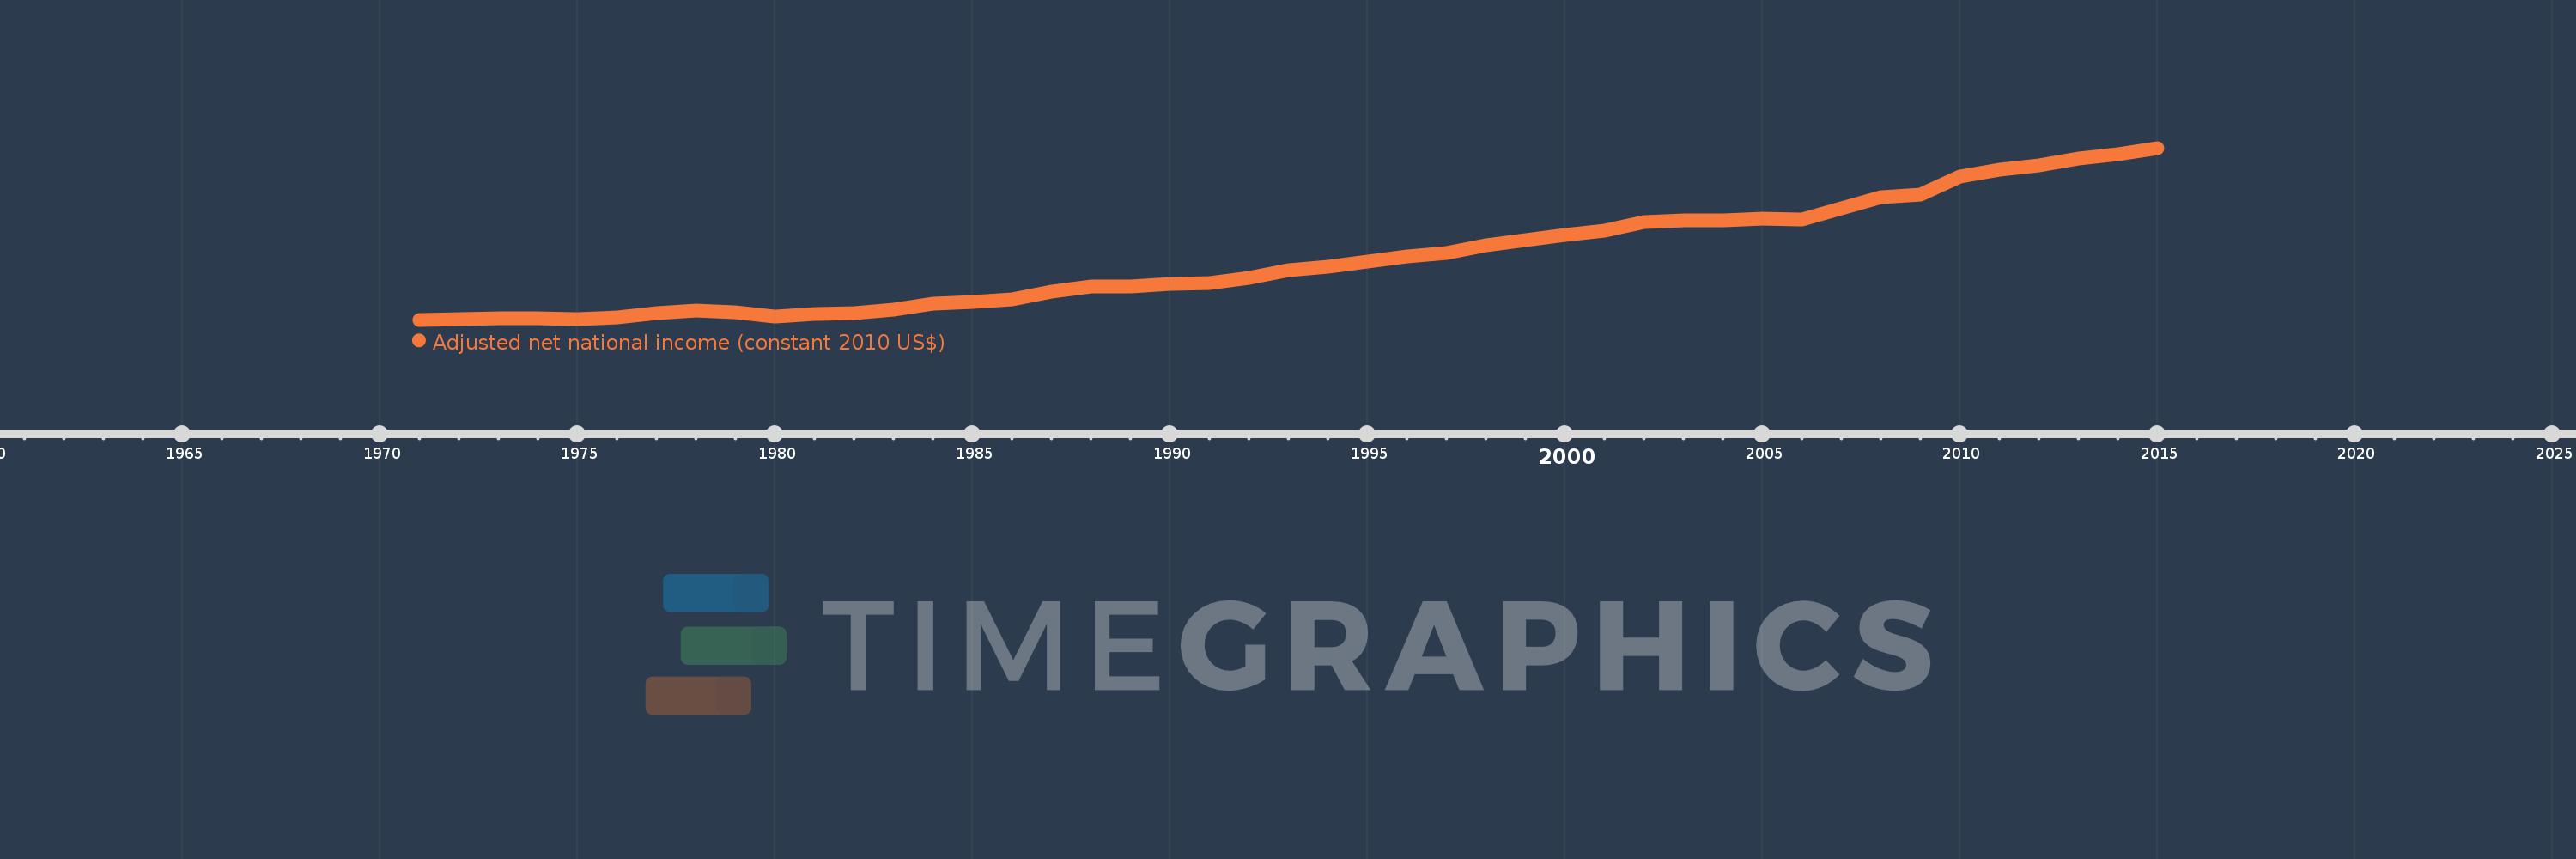
Adjusted net national income (constant 2010 US$)
2015,2014,2013,2012,2011,2010,2009,2008,2007,2006,2005,2004,2003,2002,2001,2000,1999,1998,1997,1996,1995,1994,1993,1992,1991,1990,1989,1988,1987,1986,1985,1984,1983,1982,1981,1980,1979,1978,1977,1976,1975,1974,1973,1972,1971
This statistics in other country:
AfghanistanAlbaniaAlgeriaAngolaArab WorldArgentinaArmeniaAustraliaAustriaAzerbaijanBahamas, TheBahrainBangladeshBarbadosBelarusBelgiumBelizeBeninBhutanBoliviaBotswanaBrazilBulgariaBurkina FasoBurundiCabo VerdeCambodiaCameroonCanadaCaribbean small statesCentral African RepublicCentral Europe and the BalticsChadChileChinaColombiaComorosCongo, Dem. Rep.Congo, Rep.Costa RicaCote d'IvoireCroatiaCubaCyprusCzech RepublicDenmarkDominicaDominican RepublicEarly-demographic dividendEast Asia & PacificEast Asia & Pacific (excluding high income)East Asia & Pacific (IDA & IBRD countries)EcuadorEgypt, Arab Rep.El SalvadorEritreaEstoniaEthiopiaEuro areaEurope & Central AsiaEurope & Central Asia (excluding high income)Europe & Central Asia (IDA & IBRD countries)European UnionFijiFinlandFragile and conflict affected situationsFranceGabonGambia, TheGeorgiaGermanyGhanaGreeceGuatemalaGuineaGuinea-BissauGuyanaHaitiHeavily indebted poor countries (HIPC)High incomeHondurasHungaryIBRD onlyIDA & IBRD totalIDA blendIDA onlyIDA totalIndiaIndonesiaIran, Islamic Rep.IraqIrelandIsraelItalyJamaicaJapanJordanKazakhstanKenyaKiribatiKorea, Rep.KuwaitKyrgyz RepublicLao PDRLate-demographic dividendLatin America & Caribbean Latin America & Caribbean (excluding high income)Latin America & the Caribbean (IDA & IBRD countries)LatviaLeast developed countries: UN classificationLebanonLesothoLiberiaLibyaLithuaniaLow & middle incomeLow incomeLower middle incomeLuxembourgMacedonia, FYRMadagascarMalawiMalaysiaMaldivesMaliMauritaniaMauritiusMexicoMiddle East & North AfricaMiddle East & North Africa (excluding high income)Middle East & North Africa (IDA & IBRD countries)Middle incomeMoldovaMongoliaMoroccoMozambiqueNamibiaNepalNetherlandsNew ZealandNicaraguaNigerNigeriaNorth AmericaNorwayOECD membersOmanOther small statesPacific island small statesPakistanPanamaPapua New GuineaParaguayPeruPhilippinesPolandPortugalPost-demographic dividendPre-demographic dividendQatarRomaniaRussian FederationRwandaSamoaSao Tome and PrincipeSaudi ArabiaSenegalSeychellesSierra LeoneSingaporeSlovak RepublicSloveniaSmall statesSolomon IslandsSouth AfricaSouth AsiaSouth Asia (IDA & IBRD)SpainSri LankaSt. LuciaSt. Vincent and the GrenadinesSub-Saharan Africa Sub-Saharan Africa (excluding high income)Sub-Saharan Africa (IDA & IBRD countries)SurinameSwazilandSwedenSwitzerlandTajikistanTanzaniaThailandTogoTongaTrinidad and TobagoTunisiaTurkeyTurkmenistanUgandaUkraineUnited Arab EmiratesUnited KingdomUnited StatesUpper middle incomeUruguayUzbekistanVanuatuVenezuela, RBVietnamWorldYemen, Rep.ZambiaZimbabwe Timeline:
This timeline shows a graph from 1971 to 2015 of Egypt, Arab Rep.. No data until 1970. Number of actual observations by date: 45.
Source name:
World Development Indicators
Source organization:
World Bank staff estimates based on sources and methods in World Bank's "The Changing Wealth of Nations: Measuring Sustainable Development in the New Millennium" (2011).
Categories, topics:
Economy & Growth
Last updated:
apr 23, 2017
Indicators value changes by year
Minimum:
29.479 bln
jan 1, 1971
Maximum:
205.072 bln
jan 1, 2015
At the date of observation
Value
Absolute change
Change from previous value
jan 1, 1971
29.479 bln
+29.479 bln
0.0%
jan 1, 1972
30.062 bln
+582.381 mln
1.98%
jan 1, 1973
30.713 bln
+651.123 mln
2.17%
jan 1, 1974
31.302 bln
+589.333 mln
1.92%
jan 1, 1975
30.343 bln
-958.78 mln
-3.06%
jan 1, 1976
31.717 bln
+1.374 bln
4.53%
jan 1, 1977
35.906 bln
+4.189 bln
13.21%
jan 1, 1978
38.715 bln
+2.809 bln
7.82%
jan 1, 1979
37.142 bln
-1.572 bln
-4.06%
jan 1, 1980
32.446 bln
-4.696 bln
-12.64%
jan 1, 1981
35.477 bln
+3.031 bln
9.34%
jan 1, 1982
35.94 bln
+463.578 mln
1.31%
jan 1, 1983
40.04 bln
+4.1 bln
11.41%
jan 1, 1984
46.004 bln
+5.965 bln
14.9%
jan 1, 1985
47.71 bln
+1.706 bln
3.71%
jan 1, 1986
50.342 bln
+2.632 bln
5.52%
jan 1, 1987
58.62 bln
+8.278 bln
16.44%
jan 1, 1988
63.186 bln
+4.566 bln
7.79%
jan 1, 1989
63.277 bln
+91.162 mln
0.14%
jan 1, 1990
66.284 bln
+3.007 bln
4.75%
jan 1, 1991
66.979 bln
+695.545 mln
1.05%
jan 1, 1992
72.497 bln
+5.518 bln
8.24%
jan 1, 1993
79.727 bln
+7.23 bln
9.97%
jan 1, 1994
83.832 bln
+4.105 bln
5.15%
jan 1, 1995
89.015 bln
+5.183 bln
6.18%
jan 1, 1996
93.799 bln
+4.783 bln
5.37%
jan 1, 1997
97.41 bln
+3.612 bln
3.85%
jan 1, 1998
105.411 bln
+8.001 bln
8.21%
jan 1, 1999
110.821 bln
+5.41 bln
5.13%
jan 1, 2000
115.725 bln
+4.904 bln
4.43%
jan 1, 2001
120.795 bln
+5.07 bln
4.38%
jan 1, 2002
129.346 bln
+8.551 bln
7.08%
jan 1, 2003
130.733 bln
+1.387 bln
1.07%
jan 1, 2004
131.199 bln
+465.24 mln
0.36%
jan 1, 2005
132.723 bln
+1.525 bln
1.16%
jan 1, 2006
131.749 bln
-973.878 mln
-0.73%
jan 1, 2007
142.984 bln
+11.234 bln
8.53%
jan 1, 2008
154.362 bln
+11.378 bln
7.96%
jan 1, 2009
157.069 bln
+2.708 bln
1.75%
jan 1, 2010
175.883 bln
+18.814 bln
11.98%
jan 1, 2011
182.983 bln
+7.099 bln
4.04%
jan 1, 2012
187.291 bln
+4.309 bln
2.35%
jan 1, 2013
194.29 bln
+6.999 bln
3.74%
jan 1, 2014
198.811 bln
+4.522 bln
2.33%
jan 1, 2015
205.072 bln
+6.261 bln
3.15%
Ranking of countries by current statistics by years


Comments: