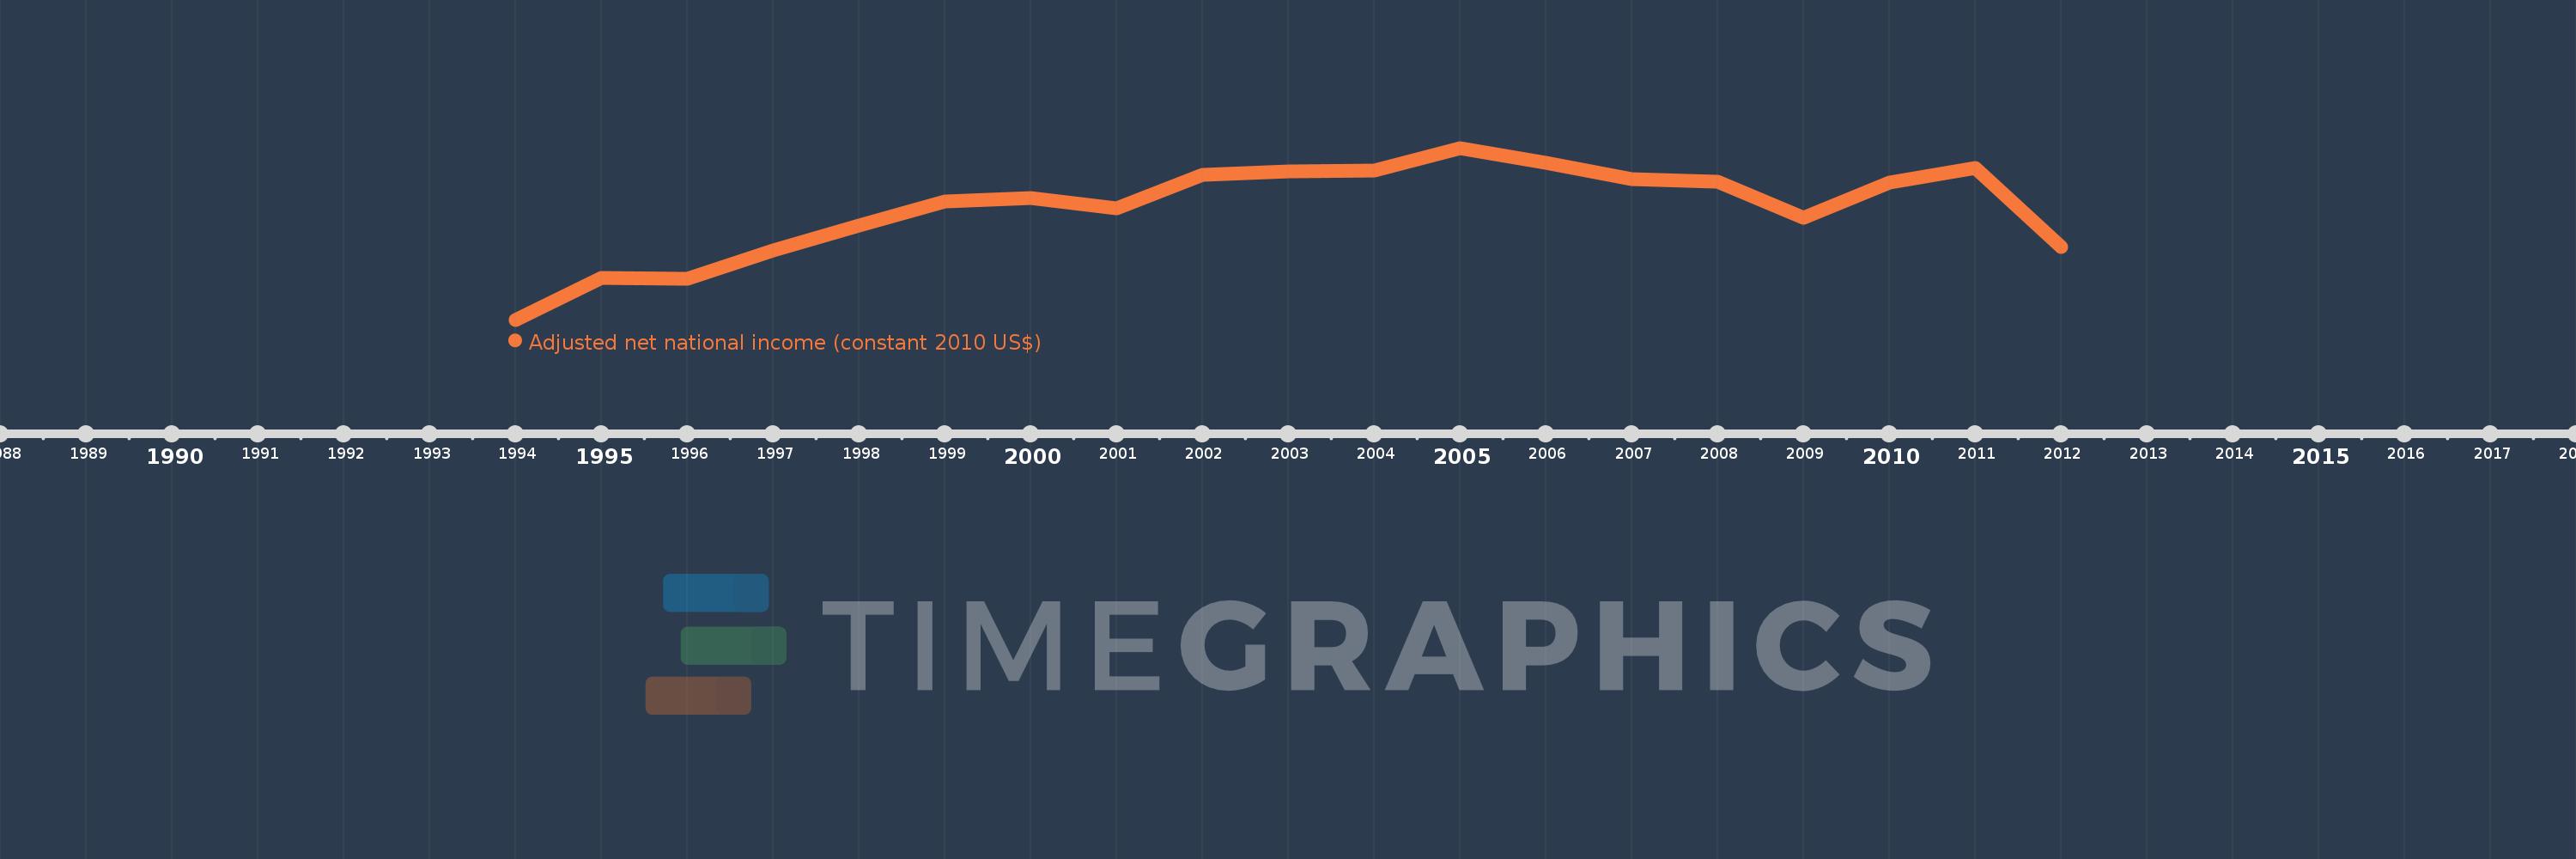
This timeline shows a graph from 1994 to 2012 of Eritrea. No data until 1993. Number of actual observations by date: 19.
Source name:
World Development Indicators
Source organization:
World Bank staff estimates based on sources and methods in World Bank's "The Changing Wealth of Nations: Measuring Sustainable Development in the New Millennium" (2011).
Categories, topics:
Economy & Growth
Last updated:
apr 23, 2017
Indicators value changes by year
Meaning:
1.668 bln
Minimum:
1.162 bln
jan 1, 1994
Maximum:
1.944 bln
jan 1, 2005
At the date of observation
Value
Absolute change
Change from the previous value
jan 1, 1994
1.162 bln
+1.162 bln
0.0%
jan 1, 1995
1.353 bln
+190.72 mln
16.41%
jan 1, 1996
1.347 bln
-6.198 mln
-0.46%
jan 1, 1997
1.479 bln
+132.255 mln
9.82%
jan 1, 1998
1.591 bln
+111.665 mln
7.55%
jan 1, 1999
1.699 bln
+108.232 mln
6.8%
jan 1, 2000
1.714 bln
+15.111 mln
0.89%
jan 1, 2001
1.668 bln
-46.693 mln
-2.72%
jan 1, 2002
1.821 bln
+153.216 mln
9.19%
jan 1, 2003
1.839 bln
+17.812 mln
0.98%
jan 1, 2004
1.843 bln
+4.352 mln
0.24%
jan 1, 2005
1.944 bln
+101.01 mln
5.48%
jan 1, 2006
1.877 bln
-67.32 mln
-3.46%
jan 1, 2007
1.8 bln
-76.447 mln
-4.07%
jan 1, 2008
1.791 bln
-9.437 mln
-0.52%
jan 1, 2009
1.626 bln
-164.47 mln
-9.18%
jan 1, 2010
1.788 bln
+162.129 mln
9.97%
jan 1, 2011
1.853 bln
+64.575 mln
3.61%
jan 1, 2012
1.494 bln
-358.58 mln
-19.35%
Ranking of countries by current statistics by years
