29
/
en
AIzaSyAYiBZKx7MnpbEhh9jyipgxe19OcubqV5w
April 1, 2024
77789
Bangladesh
BGD
true
2
1
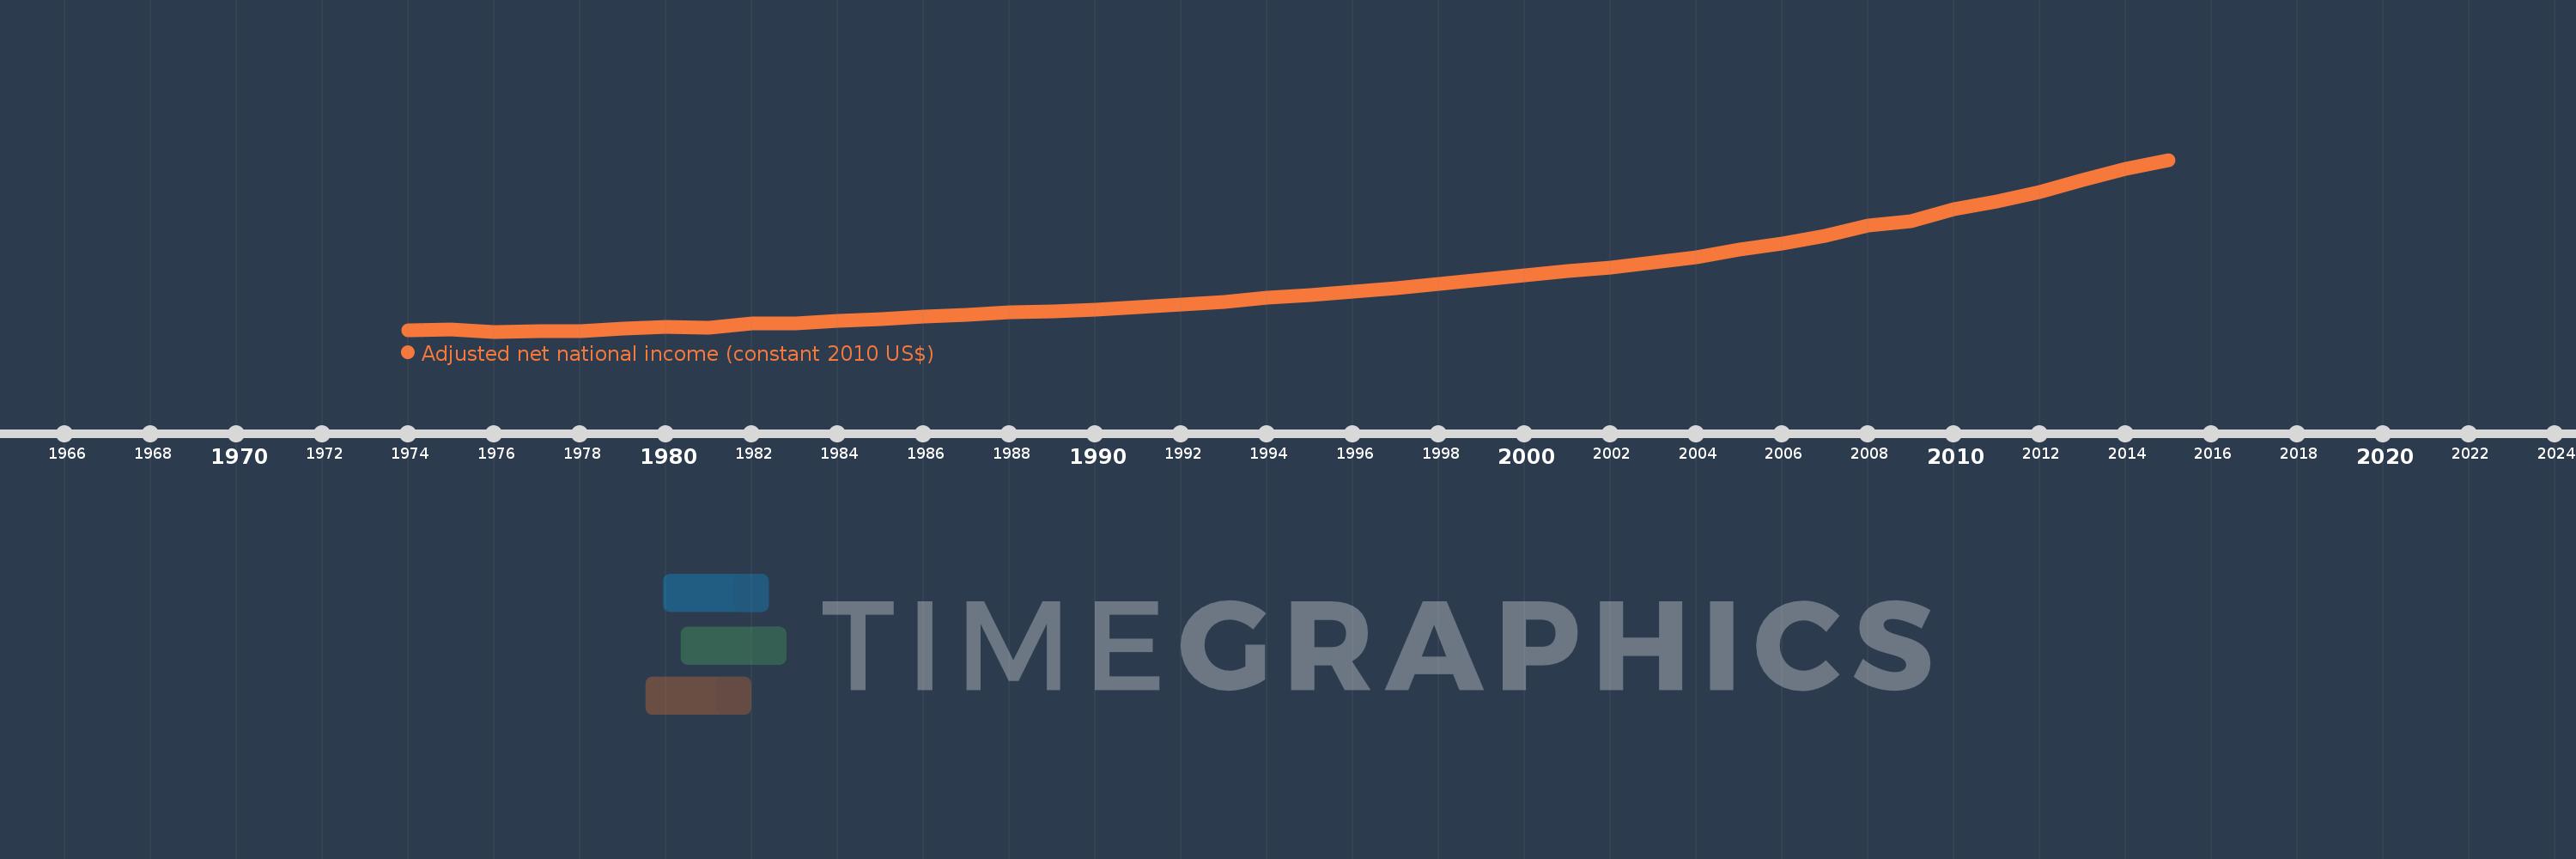
Adjusted net national income (constant 2010 US$)
2015,2014,2013,2012,2011,2010,2009,2008,2007,2006,2005,2004,2003,2002,2001,2000,1999,1998,1997,1996,1995,1994,1993,1992,1991,1990,1989,1988,1987,1986,1985,1984,1983,1982,1981,1980,1979,1978,1977,1976,1975,1974
This statistics in other country:
AfghanistanAlbaniaAlgeriaAngolaArab WorldArgentinaArmeniaAustraliaAustriaAzerbaijanBahamas, TheBahrainBangladeshBarbadosBelarusBelgiumBelizeBeninBhutanBoliviaBotswanaBrazilBulgariaBurkina FasoBurundiCabo VerdeCambodiaCameroonCanadaCaribbean small statesCentral African RepublicCentral Europe and the BalticsChadChileChinaColombiaComorosCongo, Dem. Rep.Congo, Rep.Costa RicaCote d'IvoireCroatiaCubaCyprusCzech RepublicDenmarkDominicaDominican RepublicEarly-demographic dividendEast Asia & PacificEast Asia & Pacific (excluding high income)East Asia & Pacific (IDA & IBRD countries)EcuadorEgypt, Arab Rep.El SalvadorEritreaEstoniaEthiopiaEuro areaEurope & Central AsiaEurope & Central Asia (excluding high income)Europe & Central Asia (IDA & IBRD countries)European UnionFijiFinlandFragile and conflict affected situationsFranceGabonGambia, TheGeorgiaGermanyGhanaGreeceGuatemalaGuineaGuinea-BissauGuyanaHaitiHeavily indebted poor countries (HIPC)High incomeHondurasHungaryIBRD onlyIDA & IBRD totalIDA blendIDA onlyIDA totalIndiaIndonesiaIran, Islamic Rep.IraqIrelandIsraelItalyJamaicaJapanJordanKazakhstanKenyaKiribatiKorea, Rep.KuwaitKyrgyz RepublicLao PDRLate-demographic dividendLatin America & Caribbean Latin America & Caribbean (excluding high income)Latin America & the Caribbean (IDA & IBRD countries)LatviaLeast developed countries: UN classificationLebanonLesothoLiberiaLibyaLithuaniaLow & middle incomeLow incomeLower middle incomeLuxembourgMacedonia, FYRMadagascarMalawiMalaysiaMaldivesMaliMauritaniaMauritiusMexicoMiddle East & North AfricaMiddle East & North Africa (excluding high income)Middle East & North Africa (IDA & IBRD countries)Middle incomeMoldovaMongoliaMoroccoMozambiqueNamibiaNepalNetherlandsNew ZealandNicaraguaNigerNigeriaNorth AmericaNorwayOECD membersOmanOther small statesPacific island small statesPakistanPanamaPapua New GuineaParaguayPeruPhilippinesPolandPortugalPost-demographic dividendPre-demographic dividendQatarRomaniaRussian FederationRwandaSamoaSao Tome and PrincipeSaudi ArabiaSenegalSeychellesSierra LeoneSingaporeSlovak RepublicSloveniaSmall statesSolomon IslandsSouth AfricaSouth AsiaSouth Asia (IDA & IBRD)SpainSri LankaSt. LuciaSt. Vincent and the GrenadinesSub-Saharan Africa Sub-Saharan Africa (excluding high income)Sub-Saharan Africa (IDA & IBRD countries)SurinameSwazilandSwedenSwitzerlandTajikistanTanzaniaThailandTogoTongaTrinidad and TobagoTunisiaTurkeyTurkmenistanUgandaUkraineUnited Arab EmiratesUnited KingdomUnited StatesUpper middle incomeUruguayUzbekistanVanuatuVenezuela, RBVietnamWorldYemen, Rep.ZambiaZimbabwe Timeline:
This timeline shows a graph from 1974 to 2015 of Bangladesh. No data until 1973. Number of actual observations by date: 42.
Source name:
World Development Indicators
Source organization:
World Bank staff estimates based on sources and methods in World Bank's "The Changing Wealth of Nations: Measuring Sustainable Development in the New Millennium" (2011).
Categories, topics:
Economy & Growth
Last updated:
apr 23, 2017
Indicators value changes by year
Minimum:
21.685 bln
jan 1, 1976
Maximum:
138.322 bln
jan 1, 2015
At the date of observation
Value
Absolute change
Change from previous value
jan 1, 1974
22.29 bln
+22.29 bln
0.0%
jan 1, 1975
22.949 bln
+659.313 mln
2.96%
jan 1, 1976
21.685 bln
-1.264 bln
-5.51%
jan 1, 1977
21.694 bln
+8.641 mln
0.04%
jan 1, 1978
21.985 bln
+291.038 mln
1.34%
jan 1, 1979
23.721 bln
+1.736 bln
7.9%
jan 1, 1980
24.975 bln
+1.254 bln
5.29%
jan 1, 1981
24.52 bln
-455.41 mln
-1.82%
jan 1, 1982
27.189 bln
+2.669 bln
10.88%
jan 1, 1983
27.119 bln
-69.366 mln
-0.26%
jan 1, 1984
29.091 bln
+1.972 bln
7.27%
jan 1, 1985
30.211 bln
+1.12 bln
3.85%
jan 1, 1986
31.926 bln
+1.715 bln
5.68%
jan 1, 1987
33.218 bln
+1.292 bln
4.05%
jan 1, 1988
34.753 bln
+1.535 bln
4.62%
jan 1, 1989
35.486 bln
+732.971 mln
2.11%
jan 1, 1990
36.627 bln
+1.141 bln
3.22%
jan 1, 1991
38.396 bln
+1.768 bln
4.83%
jan 1, 1992
39.966 bln
+1.57 bln
4.09%
jan 1, 1993
42.088 bln
+2.122 bln
5.31%
jan 1, 1994
44.674 bln
+2.586 bln
6.14%
jan 1, 1995
46.521 bln
+1.847 bln
4.13%
jan 1, 1996
48.683 bln
+2.162 bln
4.65%
jan 1, 1997
50.923 bln
+2.24 bln
4.6%
jan 1, 1998
53.956 bln
+3.034 bln
5.96%
jan 1, 1999
57.088 bln
+3.132 bln
5.8%
jan 1, 2000
59.601 bln
+2.513 bln
4.4%
jan 1, 2001
62.515 bln
+2.914 bln
4.89%
jan 1, 2002
65.07 bln
+2.555 bln
4.09%
jan 1, 2003
68.902 bln
+3.831 bln
5.89%
jan 1, 2004
71.859 bln
+2.957 bln
4.29%
jan 1, 2005
77.487 bln
+5.628 bln
7.83%
jan 1, 2006
81.681 bln
+4.194 bln
5.41%
jan 1, 2007
86.772 bln
+5.091 bln
6.23%
jan 1, 2008
93.531 bln
+6.759 bln
7.79%
jan 1, 2009
96.425 bln
+2.894 bln
3.09%
jan 1, 2010
104.621 bln
+8.195 bln
8.5%
jan 1, 2011
110.303 bln
+5.682 bln
5.43%
jan 1, 2012
116.169 bln
+5.866 bln
5.32%
jan 1, 2013
124.588 bln
+8.419 bln
7.25%
jan 1, 2014
131.96 bln
+7.373 bln
5.92%
jan 1, 2015
138.322 bln
+6.361 bln
4.82%
Ranking of countries by current statistics by years


Comments: