29
/
en
AIzaSyAYiBZKx7MnpbEhh9jyipgxe19OcubqV5w
April 1, 2024
135148
Gabon
GAB
true
2
1
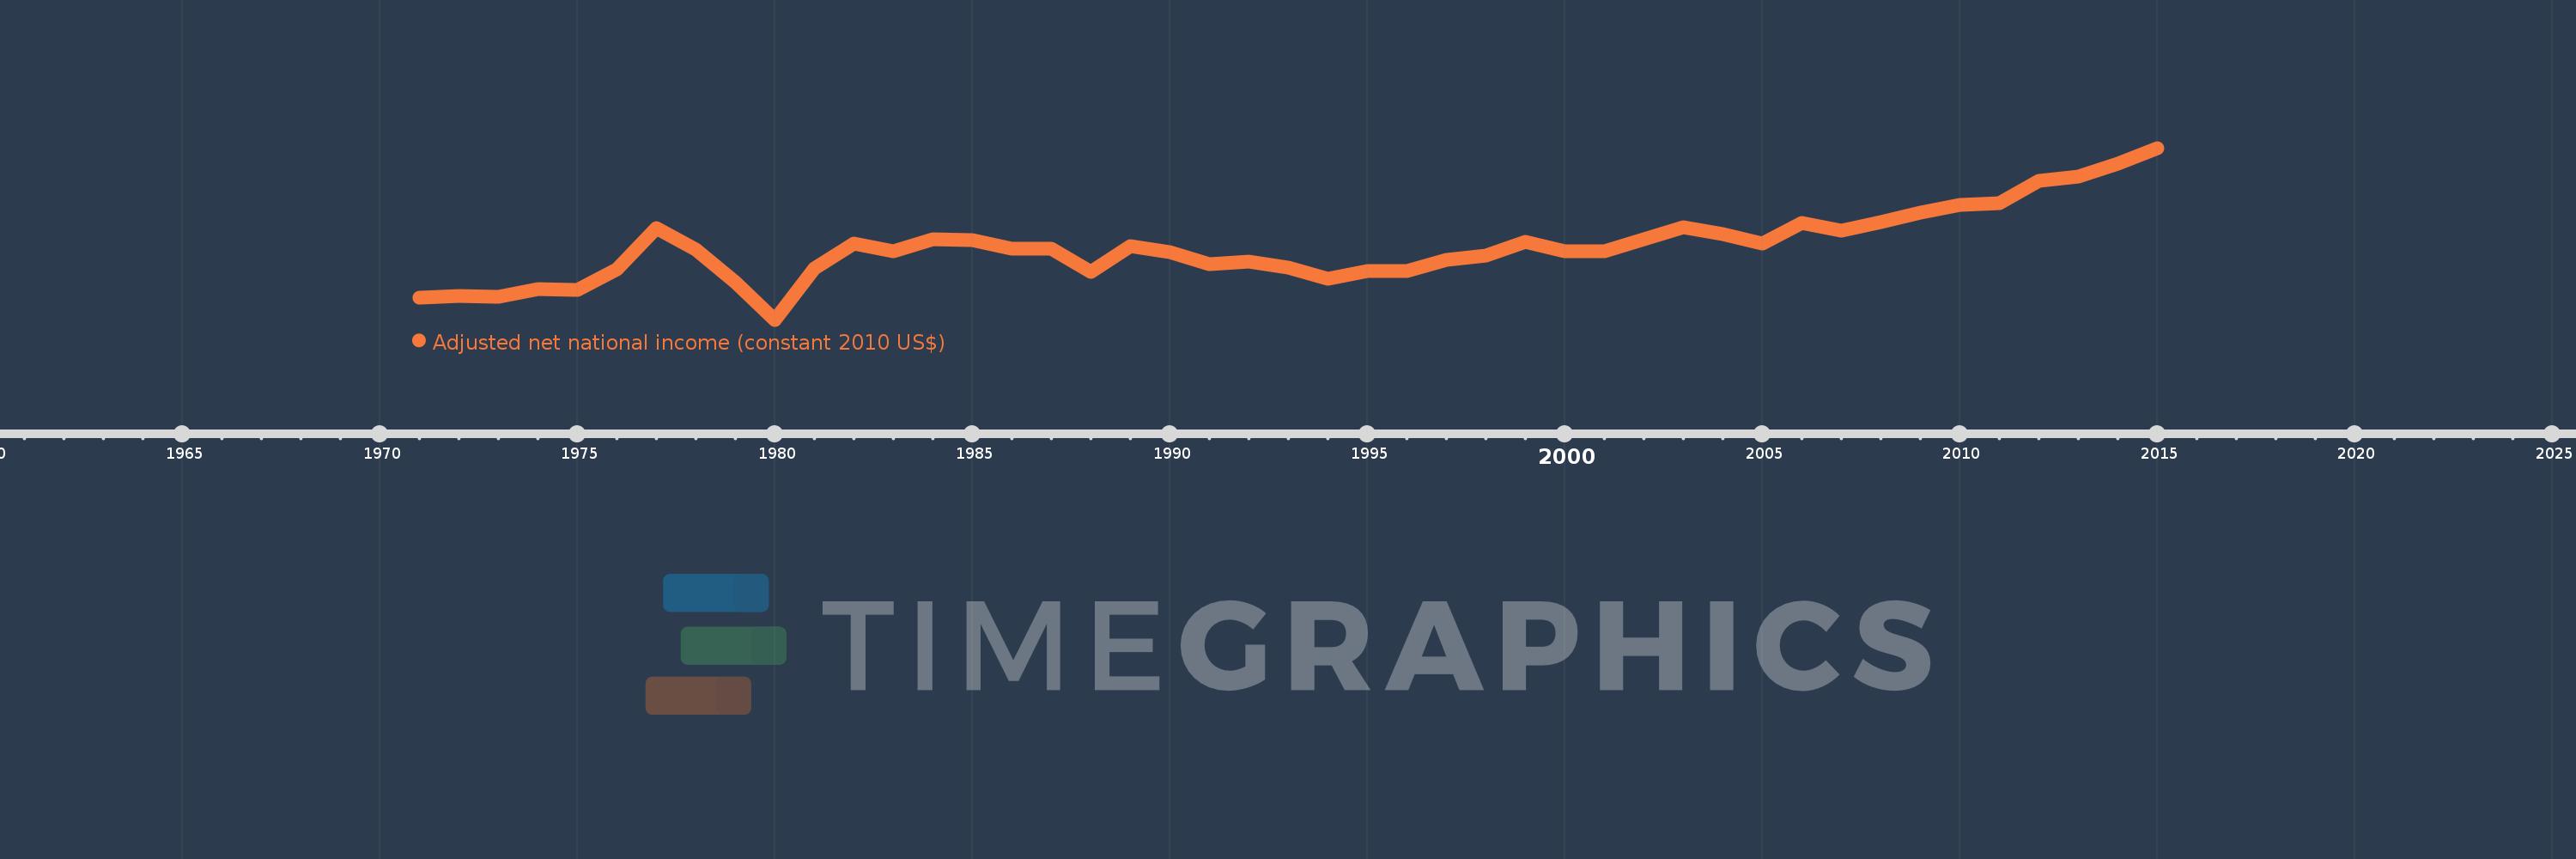
Adjusted net national income (constant 2010 US$)
2015,2014,2013,2012,2011,2010,2009,2008,2007,2006,2005,2004,2003,2002,2001,2000,1999,1998,1997,1996,1995,1994,1993,1992,1991,1990,1989,1988,1987,1986,1985,1984,1983,1982,1981,1980,1979,1978,1977,1976,1975,1974,1973,1972,1971
This statistics in other country:
AfghanistanAlbaniaAlgeriaAngolaArab WorldArgentinaArmeniaAustraliaAustriaAzerbaijanBahamas, TheBahrainBangladeshBarbadosBelarusBelgiumBelizeBeninBhutanBoliviaBotswanaBrazilBulgariaBurkina FasoBurundiCabo VerdeCambodiaCameroonCanadaCaribbean small statesCentral African RepublicCentral Europe and the BalticsChadChileChinaColombiaComorosCongo, Dem. Rep.Congo, Rep.Costa RicaCote d'IvoireCroatiaCubaCyprusCzech RepublicDenmarkDominicaDominican RepublicEarly-demographic dividendEast Asia & PacificEast Asia & Pacific (excluding high income)East Asia & Pacific (IDA & IBRD countries)EcuadorEgypt, Arab Rep.El SalvadorEritreaEstoniaEthiopiaEuro areaEurope & Central AsiaEurope & Central Asia (excluding high income)Europe & Central Asia (IDA & IBRD countries)European UnionFijiFinlandFragile and conflict affected situationsFranceGabonGambia, TheGeorgiaGermanyGhanaGreeceGuatemalaGuineaGuinea-BissauGuyanaHaitiHeavily indebted poor countries (HIPC)High incomeHondurasHungaryIBRD onlyIDA & IBRD totalIDA blendIDA onlyIDA totalIndiaIndonesiaIran, Islamic Rep.IraqIrelandIsraelItalyJamaicaJapanJordanKazakhstanKenyaKiribatiKorea, Rep.KuwaitKyrgyz RepublicLao PDRLate-demographic dividendLatin America & Caribbean Latin America & Caribbean (excluding high income)Latin America & the Caribbean (IDA & IBRD countries)LatviaLeast developed countries: UN classificationLebanonLesothoLiberiaLibyaLithuaniaLow & middle incomeLow incomeLower middle incomeLuxembourgMacedonia, FYRMadagascarMalawiMalaysiaMaldivesMaliMauritaniaMauritiusMexicoMiddle East & North AfricaMiddle East & North Africa (excluding high income)Middle East & North Africa (IDA & IBRD countries)Middle incomeMoldovaMongoliaMoroccoMozambiqueNamibiaNepalNetherlandsNew ZealandNicaraguaNigerNigeriaNorth AmericaNorwayOECD membersOmanOther small statesPacific island small statesPakistanPanamaPapua New GuineaParaguayPeruPhilippinesPolandPortugalPost-demographic dividendPre-demographic dividendQatarRomaniaRussian FederationRwandaSamoaSao Tome and PrincipeSaudi ArabiaSenegalSeychellesSierra LeoneSingaporeSlovak RepublicSloveniaSmall statesSolomon IslandsSouth AfricaSouth AsiaSouth Asia (IDA & IBRD)SpainSri LankaSt. LuciaSt. Vincent and the GrenadinesSub-Saharan Africa Sub-Saharan Africa (excluding high income)Sub-Saharan Africa (IDA & IBRD countries)SurinameSwazilandSwedenSwitzerlandTajikistanTanzaniaThailandTogoTongaTrinidad and TobagoTunisiaTurkeyTurkmenistanUgandaUkraineUnited Arab EmiratesUnited KingdomUnited StatesUpper middle incomeUruguayUzbekistanVanuatuVenezuela, RBVietnamWorldYemen, Rep.ZambiaZimbabwe Timeline:
This timeline shows a graph from 1971 to 2015 of Gabon. No data until 1970. Number of actual observations by date: 45.
Source name:
World Development Indicators
Source organization:
World Bank staff estimates based on sources and methods in World Bank's "The Changing Wealth of Nations: Measuring Sustainable Development in the New Millennium" (2011).
Categories, topics:
Economy & Growth
Last updated:
apr 23, 2017
Indicators value changes by year
Minimum:
775.214 mln
jan 1, 1980
Maximum:
9.005 bln
jan 1, 2015
At the date of observation
Value
Absolute change
Change from previous value
jan 1, 1971
1.844 bln
+1.844 bln
0.0%
jan 1, 1972
1.921 bln
+76.62 mln
4.15%
jan 1, 1973
1.893 bln
-27.657 mln
-1.44%
jan 1, 1974
2.251 bln
+357.884 mln
18.9%
jan 1, 1975
2.188 bln
-63.247 mln
-2.81%
jan 1, 1976
3.188 bln
+1.0 bln
45.71%
jan 1, 1977
5.154 bln
+1.966 bln
61.66%
jan 1, 1978
4.155 bln
-998.634 mln
-19.38%
jan 1, 1979
2.565 bln
-1.59 bln
-38.27%
jan 1, 1980
775.214 mln
-1.79 bln
-69.77%
jan 1, 1981
3.225 bln
+2.45 bln
316.07%
jan 1, 1982
4.423 bln
+1.198 bln
37.13%
jan 1, 1983
4.058 bln
-364.902 mln
-8.25%
jan 1, 1984
4.624 bln
+566.192 mln
13.95%
jan 1, 1985
4.573 bln
-51.47 mln
-1.11%
jan 1, 1986
4.185 bln
-387.603 mln
-8.48%
jan 1, 1987
4.173 bln
-12.664 mln
-0.3%
jan 1, 1988
3.064 bln
-1.109 bln
-26.58%
jan 1, 1989
4.289 bln
+1.226 bln
40.01%
jan 1, 1990
4.009 bln
-280.074 mln
-6.53%
jan 1, 1991
3.423 bln
-586.62 mln
-14.63%
jan 1, 1992
3.568 bln
+144.831 mln
4.23%
jan 1, 1993
3.257 bln
-310.708 mln
-8.71%
jan 1, 1994
2.754 bln
-502.734 mln
-15.44%
jan 1, 1995
3.116 bln
+362.425 mln
13.16%
jan 1, 1996
3.094 bln
-22.958 mln
-0.74%
jan 1, 1997
3.663 bln
+569.216 mln
18.4%
jan 1, 1998
3.832 bln
+168.811 mln
4.61%
jan 1, 1999
4.487 bln
+655.899 mln
17.12%
jan 1, 2000
4.048 bln
-439.411 mln
-9.79%
jan 1, 2001
4.037 bln
-11.355 mln
-0.28%
jan 1, 2002
4.634 bln
+597.243 mln
14.8%
jan 1, 2003
5.19 bln
+556.384 mln
12.01%
jan 1, 2004
4.879 bln
-311.402 mln
-6.0%
jan 1, 2005
4.407 bln
-472.013 mln
-9.67%
jan 1, 2006
5.402 bln
+995.062 mln
22.58%
jan 1, 2007
5.035 bln
-367.184 mln
-6.8%
jan 1, 2008
5.465 bln
+429.924 mln
8.54%
jan 1, 2009
5.926 bln
+460.889 mln
8.43%
jan 1, 2010
6.294 bln
+368.838 mln
6.22%
jan 1, 2011
6.367 bln
+72.404 mln
1.15%
jan 1, 2012
7.422 bln
+1.055 bln
16.57%
jan 1, 2013
7.651 bln
+229.515 mln
3.09%
jan 1, 2014
8.268 bln
+616.675 mln
8.06%
jan 1, 2015
9.005 bln
+736.713 mln
8.91%
Ranking of countries by current statistics by years


Comments: