29
/
en
AIzaSyAYiBZKx7MnpbEhh9jyipgxe19OcubqV5w
April 1, 2024
256989
Switzerland
CHE
true
2
1
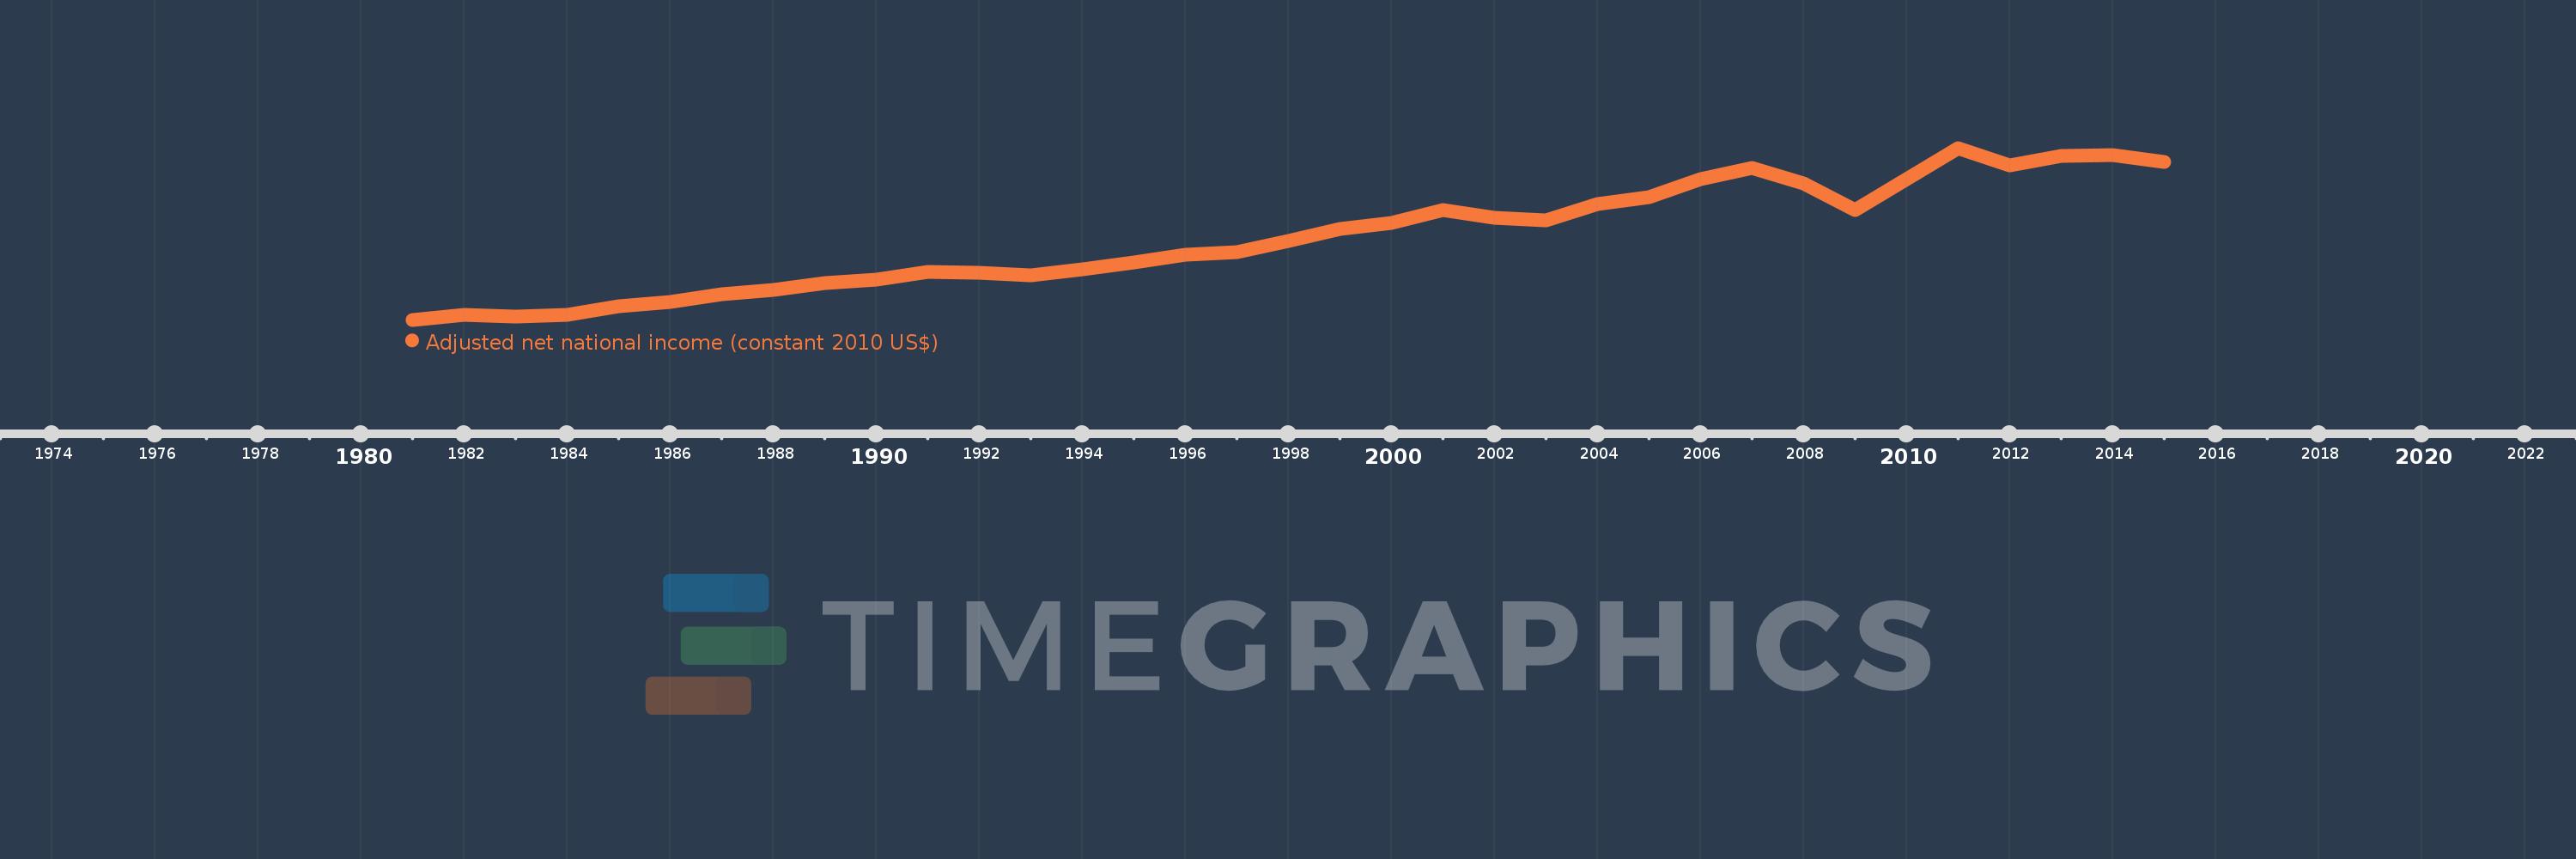
Adjusted net national income (constant 2010 US$)
2015,2014,2013,2012,2011,2010,2009,2008,2007,2006,2005,2004,2003,2002,2001,2000,1999,1998,1997,1996,1995,1994,1993,1992,1991,1990,1989,1988,1987,1986,1985,1984,1983,1982,1981
This statistics in other country:
AfghanistanAlbaniaAlgeriaAngolaArab WorldArgentinaArmeniaAustraliaAustriaAzerbaijanBahamas, TheBahrainBangladeshBarbadosBelarusBelgiumBelizeBeninBhutanBoliviaBotswanaBrazilBulgariaBurkina FasoBurundiCabo VerdeCambodiaCameroonCanadaCaribbean small statesCentral African RepublicCentral Europe and the BalticsChadChileChinaColombiaComorosCongo, Dem. Rep.Congo, Rep.Costa RicaCote d'IvoireCroatiaCubaCyprusCzech RepublicDenmarkDominicaDominican RepublicEarly-demographic dividendEast Asia & PacificEast Asia & Pacific (excluding high income)East Asia & Pacific (IDA & IBRD countries)EcuadorEgypt, Arab Rep.El SalvadorEritreaEstoniaEthiopiaEuro areaEurope & Central AsiaEurope & Central Asia (excluding high income)Europe & Central Asia (IDA & IBRD countries)European UnionFijiFinlandFragile and conflict affected situationsFranceGabonGambia, TheGeorgiaGermanyGhanaGreeceGuatemalaGuineaGuinea-BissauGuyanaHaitiHeavily indebted poor countries (HIPC)High incomeHondurasHungaryIBRD onlyIDA & IBRD totalIDA blendIDA onlyIDA totalIndiaIndonesiaIran, Islamic Rep.IraqIrelandIsraelItalyJamaicaJapanJordanKazakhstanKenyaKiribatiKorea, Rep.KuwaitKyrgyz RepublicLao PDRLate-demographic dividendLatin America & Caribbean Latin America & Caribbean (excluding high income)Latin America & the Caribbean (IDA & IBRD countries)LatviaLeast developed countries: UN classificationLebanonLesothoLiberiaLibyaLithuaniaLow & middle incomeLow incomeLower middle incomeLuxembourgMacedonia, FYRMadagascarMalawiMalaysiaMaldivesMaliMauritaniaMauritiusMexicoMiddle East & North AfricaMiddle East & North Africa (excluding high income)Middle East & North Africa (IDA & IBRD countries)Middle incomeMoldovaMongoliaMoroccoMozambiqueNamibiaNepalNetherlandsNew ZealandNicaraguaNigerNigeriaNorth AmericaNorwayOECD membersOmanOther small statesPacific island small statesPakistanPanamaPapua New GuineaParaguayPeruPhilippinesPolandPortugalPost-demographic dividendPre-demographic dividendQatarRomaniaRussian FederationRwandaSamoaSao Tome and PrincipeSaudi ArabiaSenegalSeychellesSierra LeoneSingaporeSlovak RepublicSloveniaSmall statesSolomon IslandsSouth AfricaSouth AsiaSouth Asia (IDA & IBRD)SpainSri LankaSt. LuciaSt. Vincent and the GrenadinesSub-Saharan Africa Sub-Saharan Africa (excluding high income)Sub-Saharan Africa (IDA & IBRD countries)SurinameSwazilandSwedenSwitzerlandTajikistanTanzaniaThailandTogoTongaTrinidad and TobagoTunisiaTurkeyTurkmenistanUgandaUkraineUnited Arab EmiratesUnited KingdomUnited StatesUpper middle incomeUruguayUzbekistanVanuatuVenezuela, RBVietnamWorldYemen, Rep.ZambiaZimbabwe Timeline:
This timeline shows a graph from 1981 to 2015 of Switzerland. No data until 1980. Number of actual observations by date: 35.
Source name:
World Development Indicators
Source organization:
World Bank staff estimates based on sources and methods in World Bank's "The Changing Wealth of Nations: Measuring Sustainable Development in the New Millennium" (2011).
Categories, topics:
Economy & Growth
Last updated:
apr 23, 2017
Indicators value changes by year
Minimum:
273.207 bln
jan 1, 1981
Maximum:
495.43 bln
jan 1, 2011
At the date of observation
Value
Absolute change
Change from previous value
jan 1, 1981
273.207 bln
+273.207 bln
0.0%
jan 1, 1982
279.016 bln
+5.809 bln
2.13%
jan 1, 1983
277.721 bln
-1.295 bln
-0.46%
jan 1, 1984
279.846 bln
+2.125 bln
0.77%
jan 1, 1985
290.829 bln
+10.983 bln
3.92%
jan 1, 1986
295.793 bln
+4.964 bln
1.71%
jan 1, 1987
306.762 bln
+10.97 bln
3.71%
jan 1, 1988
311.966 bln
+5.204 bln
1.7%
jan 1, 1989
320.134 bln
+8.168 bln
2.62%
jan 1, 1990
325.22 bln
+5.086 bln
1.59%
jan 1, 1991
335.254 bln
+10.034 bln
3.09%
jan 1, 1992
334.165 bln
-1.089 bln
-0.32%
jan 1, 1993
330.64 bln
-3.525 bln
-1.05%
jan 1, 1994
338.95 bln
+8.31 bln
2.51%
jan 1, 1995
347.129 bln
+8.179 bln
2.41%
jan 1, 1996
357.782 bln
+10.653 bln
3.07%
jan 1, 1997
360.969 bln
+3.188 bln
0.89%
jan 1, 1998
375.071 bln
+14.102 bln
3.91%
jan 1, 1999
390.364 bln
+15.292 bln
4.08%
jan 1, 2000
398.664 bln
+8.3 bln
2.13%
jan 1, 2001
414.549 bln
+15.885 bln
3.98%
jan 1, 2002
404.832 bln
-9.717 bln
-2.34%
jan 1, 2003
401.54 bln
-3.292 bln
-0.81%
jan 1, 2004
423.029 bln
+21.489 bln
5.35%
jan 1, 2005
431.875 bln
+8.846 bln
2.09%
jan 1, 2006
455.643 bln
+23.769 bln
5.5%
jan 1, 2007
469.508 bln
+13.865 bln
3.04%
jan 1, 2008
449.813 bln
-19.695 bln
-4.19%
jan 1, 2009
415.599 bln
-34.215 bln
-7.61%
jan 1, 2010
454.747 bln
+39.149 bln
9.42%
jan 1, 2011
495.43 bln
+40.682 bln
8.95%
jan 1, 2012
473.102 bln
-22.327 bln
-4.51%
jan 1, 2013
484.963 bln
+11.86 bln
2.51%
jan 1, 2014
486.378 bln
+1.415 bln
0.29%
jan 1, 2015
477.547 bln
-8.831 bln
-1.82%
Ranking of countries by current statistics by years


Comments: