29
/
en
AIzaSyAYiBZKx7MnpbEhh9jyipgxe19OcubqV5w
April 1, 2024
266492
Trinidad and Tobago
TTO
true
2
1
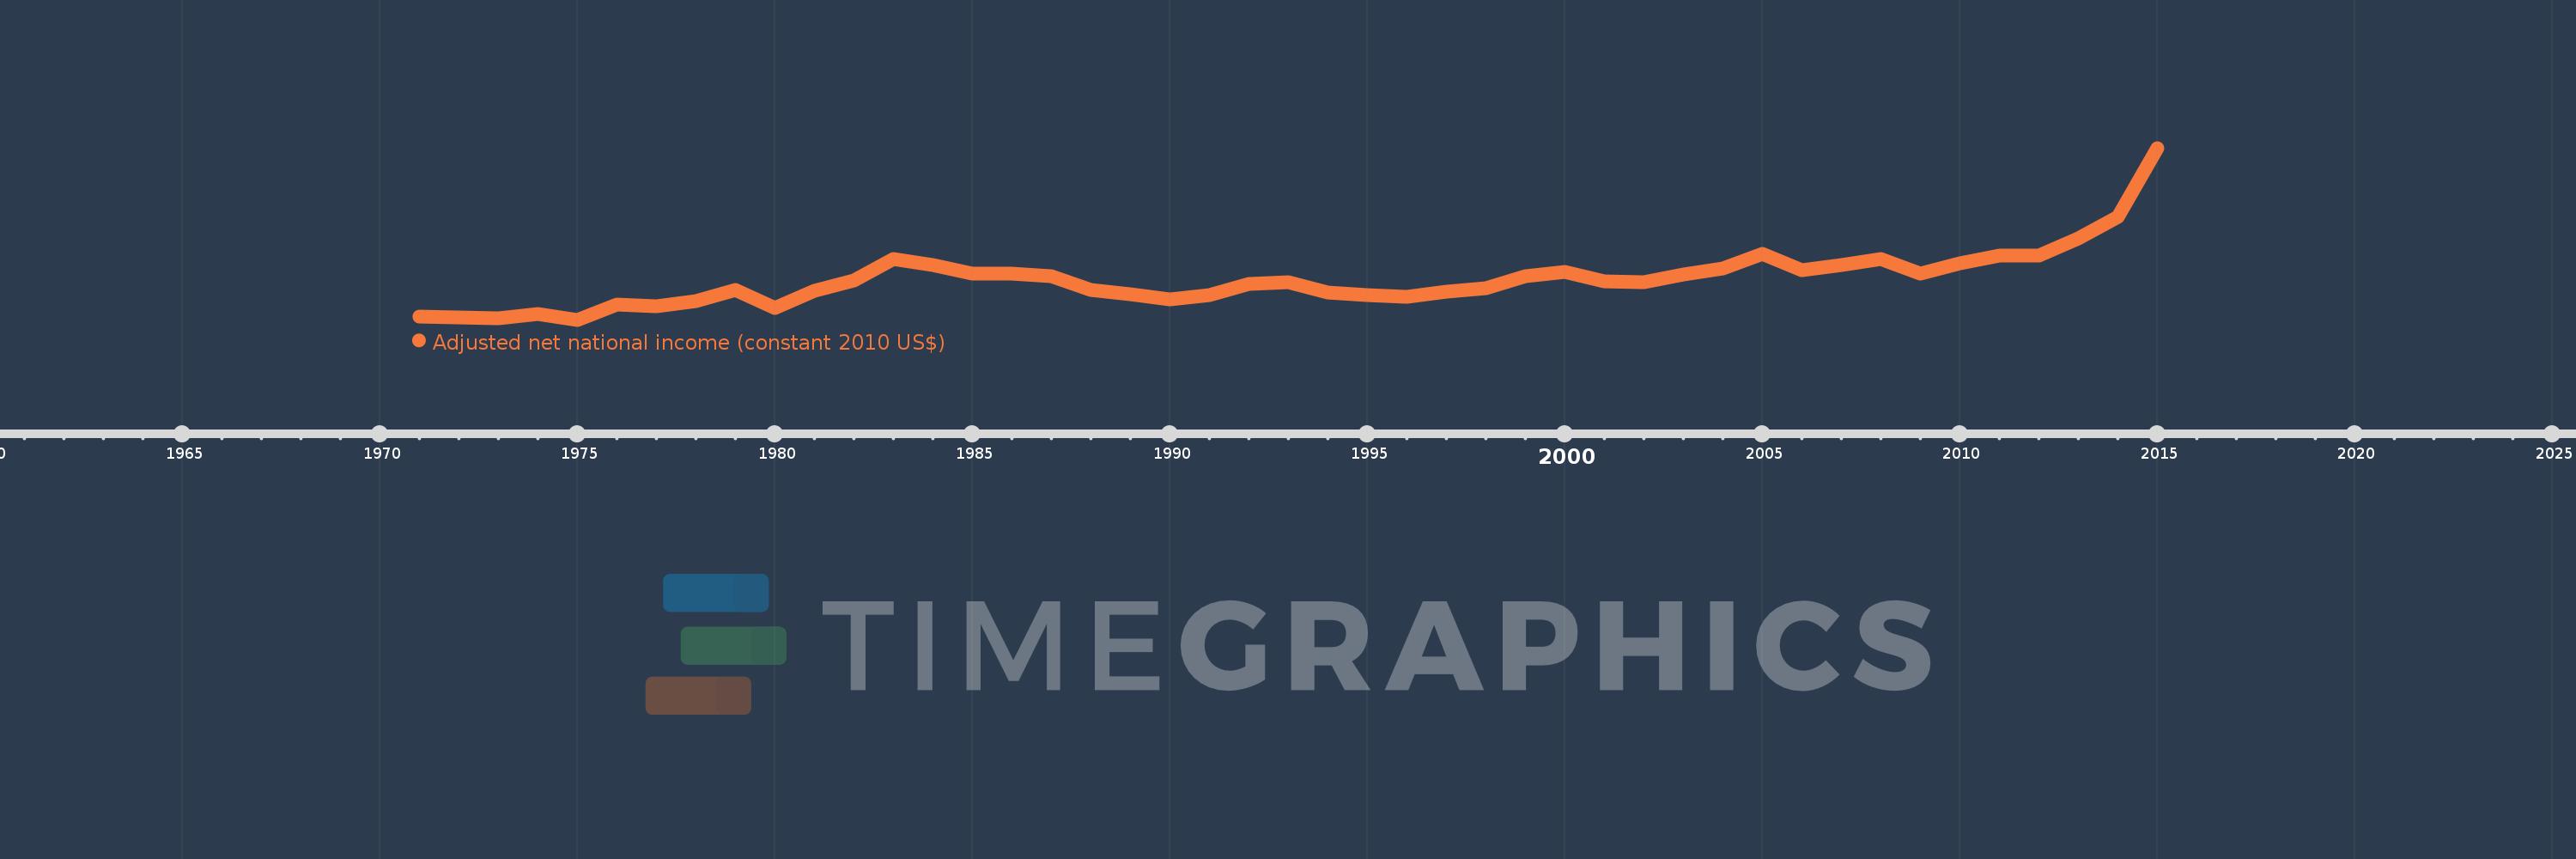
Adjusted net national income (constant 2010 US$)
2015,2014,2013,2012,2011,2010,2009,2008,2007,2006,2005,2004,2003,2002,2001,2000,1999,1998,1997,1996,1995,1994,1993,1992,1991,1990,1989,1988,1987,1986,1985,1984,1983,1982,1981,1980,1979,1978,1977,1976,1975,1974,1973,1972,1971
This statistics in other country:
AfghanistanAlbaniaAlgeriaAngolaArab WorldArgentinaArmeniaAustraliaAustriaAzerbaijanBahamas, TheBahrainBangladeshBarbadosBelarusBelgiumBelizeBeninBhutanBoliviaBotswanaBrazilBulgariaBurkina FasoBurundiCabo VerdeCambodiaCameroonCanadaCaribbean small statesCentral African RepublicCentral Europe and the BalticsChadChileChinaColombiaComorosCongo, Dem. Rep.Congo, Rep.Costa RicaCote d'IvoireCroatiaCubaCyprusCzech RepublicDenmarkDominicaDominican RepublicEarly-demographic dividendEast Asia & PacificEast Asia & Pacific (excluding high income)East Asia & Pacific (IDA & IBRD countries)EcuadorEgypt, Arab Rep.El SalvadorEritreaEstoniaEthiopiaEuro areaEurope & Central AsiaEurope & Central Asia (excluding high income)Europe & Central Asia (IDA & IBRD countries)European UnionFijiFinlandFragile and conflict affected situationsFranceGabonGambia, TheGeorgiaGermanyGhanaGreeceGuatemalaGuineaGuinea-BissauGuyanaHaitiHeavily indebted poor countries (HIPC)High incomeHondurasHungaryIBRD onlyIDA & IBRD totalIDA blendIDA onlyIDA totalIndiaIndonesiaIran, Islamic Rep.IraqIrelandIsraelItalyJamaicaJapanJordanKazakhstanKenyaKiribatiKorea, Rep.KuwaitKyrgyz RepublicLao PDRLate-demographic dividendLatin America & Caribbean Latin America & Caribbean (excluding high income)Latin America & the Caribbean (IDA & IBRD countries)LatviaLeast developed countries: UN classificationLebanonLesothoLiberiaLibyaLithuaniaLow & middle incomeLow incomeLower middle incomeLuxembourgMacedonia, FYRMadagascarMalawiMalaysiaMaldivesMaliMauritaniaMauritiusMexicoMiddle East & North AfricaMiddle East & North Africa (excluding high income)Middle East & North Africa (IDA & IBRD countries)Middle incomeMoldovaMongoliaMoroccoMozambiqueNamibiaNepalNetherlandsNew ZealandNicaraguaNigerNigeriaNorth AmericaNorwayOECD membersOmanOther small statesPacific island small statesPakistanPanamaPapua New GuineaParaguayPeruPhilippinesPolandPortugalPost-demographic dividendPre-demographic dividendQatarRomaniaRussian FederationRwandaSamoaSao Tome and PrincipeSaudi ArabiaSenegalSeychellesSierra LeoneSingaporeSlovak RepublicSloveniaSmall statesSolomon IslandsSouth AfricaSouth AsiaSouth Asia (IDA & IBRD)SpainSri LankaSt. LuciaSt. Vincent and the GrenadinesSub-Saharan Africa Sub-Saharan Africa (excluding high income)Sub-Saharan Africa (IDA & IBRD countries)SurinameSwazilandSwedenSwitzerlandTajikistanTanzaniaThailandTogoTongaTrinidad and TobagoTunisiaTurkeyTurkmenistanUgandaUkraineUnited Arab EmiratesUnited KingdomUnited StatesUpper middle incomeUruguayUzbekistanVanuatuVenezuela, RBVietnamWorldYemen, Rep.ZambiaZimbabwe Timeline:
This timeline shows a graph from 1971 to 2015 of Trinidad and Tobago. No data until 1970. Number of actual observations by date: 45.
Source name:
World Development Indicators
Source organization:
World Bank staff estimates based on sources and methods in World Bank's "The Changing Wealth of Nations: Measuring Sustainable Development in the New Millennium" (2011).
Categories, topics:
Economy & Growth
Last updated:
apr 23, 2017
Indicators value changes by year
Minimum:
4.874 bln
jan 1, 1975
Maximum:
22.391 bln
jan 1, 2015
At the date of observation
Value
Absolute change
Change from previous value
jan 1, 1971
5.185 bln
+5.185 bln
0.0%
jan 1, 1972
5.102 bln
-83.341 mln
-1.61%
jan 1, 1973
4.981 bln
-121.102 mln
-2.37%
jan 1, 1974
5.436 bln
+454.986 mln
9.13%
jan 1, 1975
4.874 bln
-562.262 mln
-10.34%
jan 1, 1976
6.386 bln
+1.513 bln
31.04%
jan 1, 1977
6.266 bln
-120.351 mln
-1.88%
jan 1, 1978
6.743 bln
+476.975 mln
7.61%
jan 1, 1979
7.906 bln
+1.163 bln
17.25%
jan 1, 1980
6.051 bln
-1.855 bln
-23.46%
jan 1, 1981
7.792 bln
+1.741 bln
28.78%
jan 1, 1982
8.861 bln
+1.069 bln
13.72%
jan 1, 1983
11.102 bln
+2.241 bln
25.29%
jan 1, 1984
10.417 bln
-684.456 mln
-6.17%
jan 1, 1985
9.589 bln
-827.992 mln
-7.95%
jan 1, 1986
9.537 bln
-52.371 mln
-0.55%
jan 1, 1987
9.299 bln
-238.076 mln
-2.5%
jan 1, 1988
7.884 bln
-1.415 bln
-15.22%
jan 1, 1989
7.47 bln
-414.038 mln
-5.25%
jan 1, 1990
6.989 bln
-480.879 mln
-6.44%
jan 1, 1991
7.422 bln
+432.696 mln
6.19%
jan 1, 1992
8.515 bln
+1.094 bln
14.74%
jan 1, 1993
8.677 bln
+161.468 mln
1.9%
jan 1, 1994
7.609 bln
-1.068 bln
-12.31%
jan 1, 1995
7.344 bln
-264.635 mln
-3.48%
jan 1, 1996
7.234 bln
-110.077 mln
-1.5%
jan 1, 1997
7.756 bln
+521.822 mln
7.21%
jan 1, 1998
8.073 bln
+317.543 mln
4.09%
jan 1, 1999
9.346 bln
+1.273 bln
15.76%
jan 1, 2000
9.758 bln
+411.563 mln
4.4%
jan 1, 2001
8.824 bln
-934.157 mln
-9.57%
jan 1, 2002
8.716 bln
-107.204 mln
-1.21%
jan 1, 2003
9.477 bln
+760.531 mln
8.73%
jan 1, 2004
10.135 bln
+657.567 mln
6.94%
jan 1, 2005
11.617 bln
+1.483 bln
14.63%
jan 1, 2006
9.897 bln
-1.72 bln
-14.8%
jan 1, 2007
10.44 bln
+542.509 mln
5.48%
jan 1, 2008
11.089 bln
+649.316 mln
6.22%
jan 1, 2009
9.611 bln
-1.479 bln
-13.34%
jan 1, 2010
10.61 bln
+999.57 mln
10.4%
jan 1, 2011
11.453 bln
+842.827 mln
7.94%
jan 1, 2012
11.449 bln
-3.736 mln
-0.03%
jan 1, 2013
13.178 bln
+1.729 bln
15.1%
jan 1, 2014
15.336 bln
+2.158 bln
16.38%
jan 1, 2015
22.391 bln
+7.055 bln
46.0%
Ranking of countries by current statistics by years


Comments: