29
/
en
AIzaSyAYiBZKx7MnpbEhh9jyipgxe19OcubqV5w
April 1, 2024
159096
Ireland
IRL
true
2
1
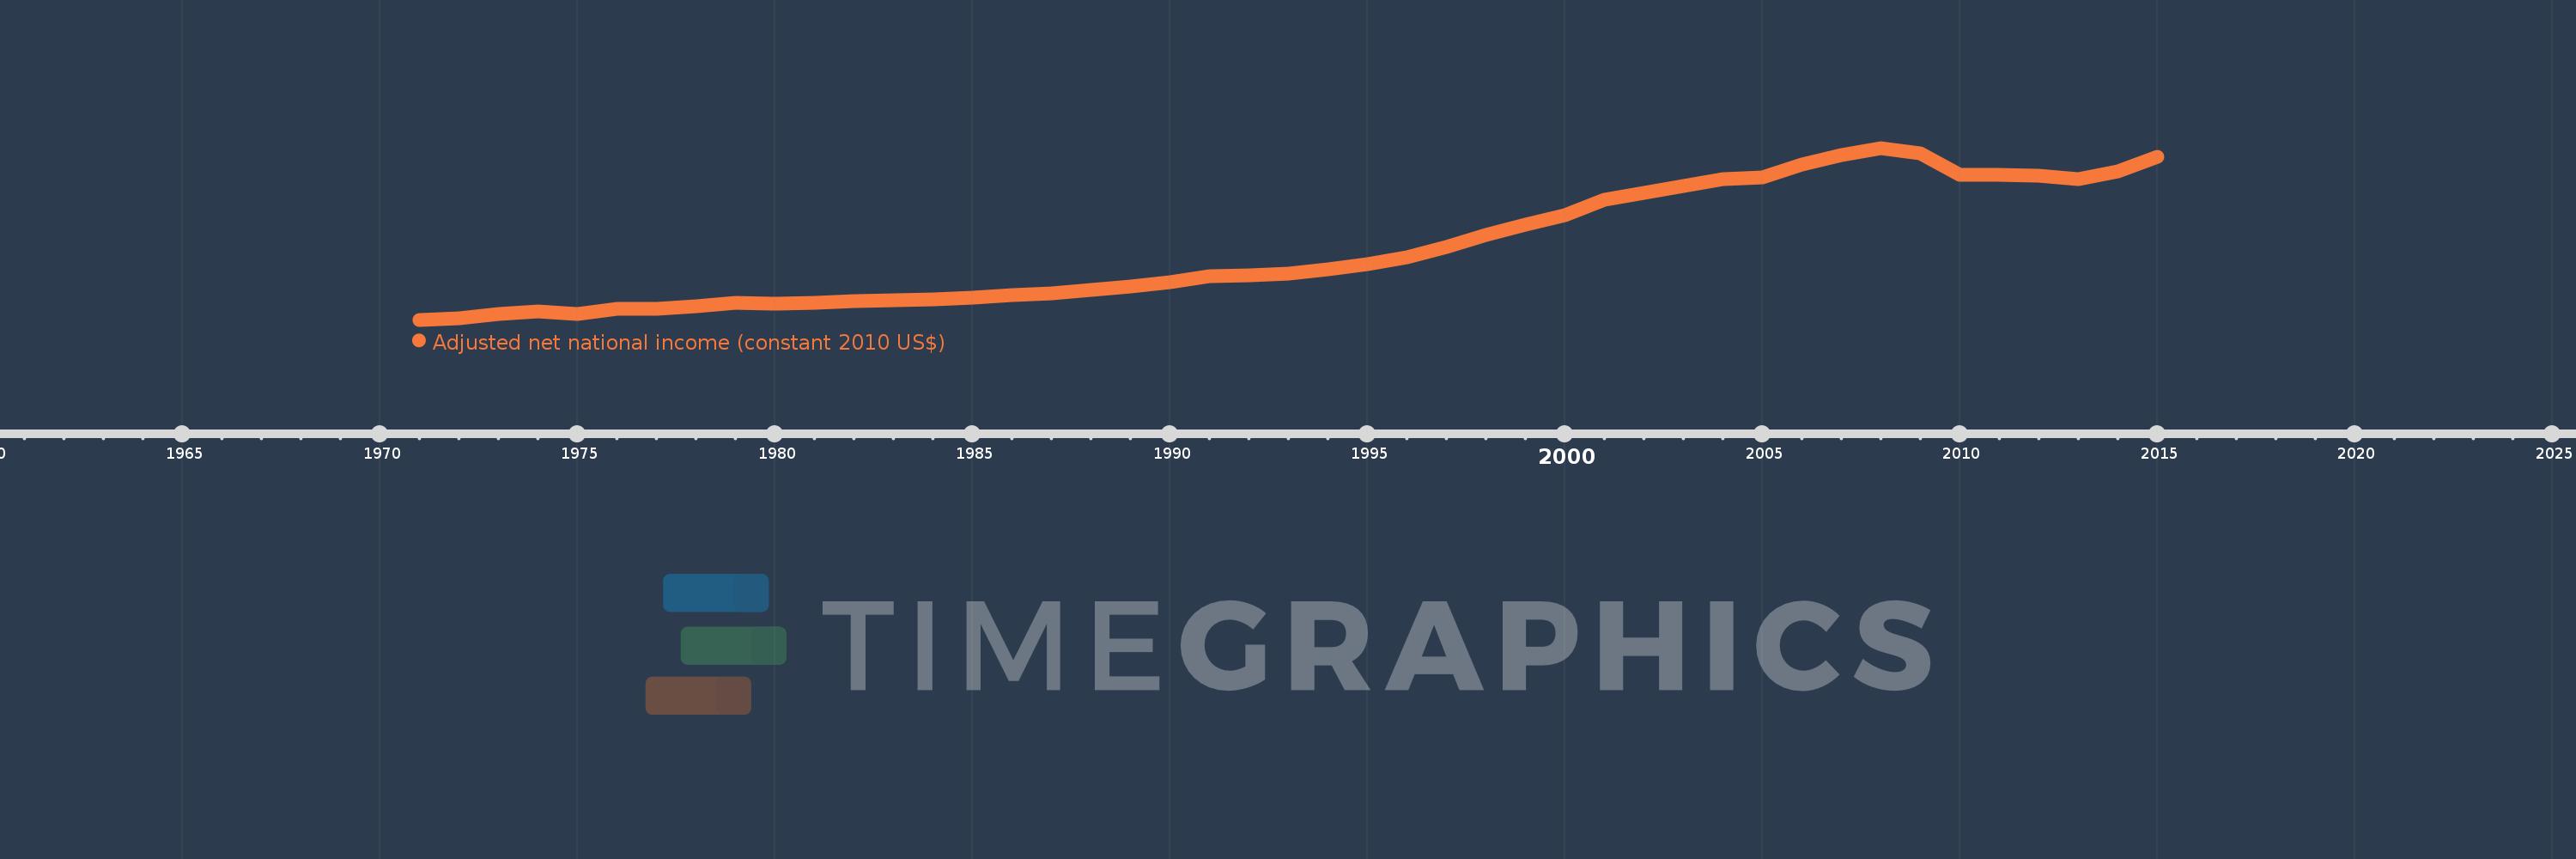
Adjusted net national income (constant 2010 US$)
2015,2014,2013,2012,2011,2010,2009,2008,2007,2006,2005,2004,2003,2002,2001,2000,1999,1998,1997,1996,1995,1994,1993,1992,1991,1990,1989,1988,1987,1986,1985,1984,1983,1982,1981,1980,1979,1978,1977,1976,1975,1974,1973,1972,1971
This statistics in other country:
AfghanistanAlbaniaAlgeriaAngolaArab WorldArgentinaArmeniaAustraliaAustriaAzerbaijanBahamas, TheBahrainBangladeshBarbadosBelarusBelgiumBelizeBeninBhutanBoliviaBotswanaBrazilBulgariaBurkina FasoBurundiCabo VerdeCambodiaCameroonCanadaCaribbean small statesCentral African RepublicCentral Europe and the BalticsChadChileChinaColombiaComorosCongo, Dem. Rep.Congo, Rep.Costa RicaCote d'IvoireCroatiaCubaCyprusCzech RepublicDenmarkDominicaDominican RepublicEarly-demographic dividendEast Asia & PacificEast Asia & Pacific (excluding high income)East Asia & Pacific (IDA & IBRD countries)EcuadorEgypt, Arab Rep.El SalvadorEritreaEstoniaEthiopiaEuro areaEurope & Central AsiaEurope & Central Asia (excluding high income)Europe & Central Asia (IDA & IBRD countries)European UnionFijiFinlandFragile and conflict affected situationsFranceGabonGambia, TheGeorgiaGermanyGhanaGreeceGuatemalaGuineaGuinea-BissauGuyanaHaitiHeavily indebted poor countries (HIPC)High incomeHondurasHungaryIBRD onlyIDA & IBRD totalIDA blendIDA onlyIDA totalIndiaIndonesiaIran, Islamic Rep.IraqIrelandIsraelItalyJamaicaJapanJordanKazakhstanKenyaKiribatiKorea, Rep.KuwaitKyrgyz RepublicLao PDRLate-demographic dividendLatin America & Caribbean Latin America & Caribbean (excluding high income)Latin America & the Caribbean (IDA & IBRD countries)LatviaLeast developed countries: UN classificationLebanonLesothoLiberiaLibyaLithuaniaLow & middle incomeLow incomeLower middle incomeLuxembourgMacedonia, FYRMadagascarMalawiMalaysiaMaldivesMaliMauritaniaMauritiusMexicoMiddle East & North AfricaMiddle East & North Africa (excluding high income)Middle East & North Africa (IDA & IBRD countries)Middle incomeMoldovaMongoliaMoroccoMozambiqueNamibiaNepalNetherlandsNew ZealandNicaraguaNigerNigeriaNorth AmericaNorwayOECD membersOmanOther small statesPacific island small statesPakistanPanamaPapua New GuineaParaguayPeruPhilippinesPolandPortugalPost-demographic dividendPre-demographic dividendQatarRomaniaRussian FederationRwandaSamoaSao Tome and PrincipeSaudi ArabiaSenegalSeychellesSierra LeoneSingaporeSlovak RepublicSloveniaSmall statesSolomon IslandsSouth AfricaSouth AsiaSouth Asia (IDA & IBRD)SpainSri LankaSt. LuciaSt. Vincent and the GrenadinesSub-Saharan Africa Sub-Saharan Africa (excluding high income)Sub-Saharan Africa (IDA & IBRD countries)SurinameSwazilandSwedenSwitzerlandTajikistanTanzaniaThailandTogoTongaTrinidad and TobagoTunisiaTurkeyTurkmenistanUgandaUkraineUnited Arab EmiratesUnited KingdomUnited StatesUpper middle incomeUruguayUzbekistanVanuatuVenezuela, RBVietnamWorldYemen, Rep.ZambiaZimbabwe Timeline:
This timeline shows a graph from 1971 to 2015 of Ireland. No data until 1970. Number of actual observations by date: 45.
Source name:
World Development Indicators
Source organization:
World Bank staff estimates based on sources and methods in World Bank's "The Changing Wealth of Nations: Measuring Sustainable Development in the New Millennium" (2011).
Categories, topics:
Economy & Growth
Last updated:
apr 23, 2017
Indicators value changes by year
Minimum:
35.967 bln
jan 1, 1971
Maximum:
174.691 bln
jan 1, 2008
At the date of observation
Value
Absolute change
Change from previous value
jan 1, 1971
35.967 bln
+35.967 bln
0.0%
jan 1, 1972
37.421 bln
+1.454 bln
4.04%
jan 1, 1973
40.589 bln
+3.168 bln
8.47%
jan 1, 1974
42.626 bln
+2.037 bln
5.02%
jan 1, 1975
40.761 bln
-1.865 bln
-4.38%
jan 1, 1976
44.482 bln
+3.721 bln
9.13%
jan 1, 1977
44.596 bln
+113.845 mln
0.26%
jan 1, 1978
47.081 bln
+2.485 bln
5.57%
jan 1, 1979
49.38 bln
+2.299 bln
4.88%
jan 1, 1980
49.046 bln
-334.365 mln
-0.68%
jan 1, 1981
49.371 bln
+325.19 mln
0.66%
jan 1, 1982
50.675 bln
+1.304 bln
2.64%
jan 1, 1983
51.817 bln
+1.141 bln
2.25%
jan 1, 1984
52.397 bln
+579.969 mln
1.12%
jan 1, 1985
53.978 bln
+1.581 bln
3.02%
jan 1, 1986
55.538 bln
+1.56 bln
2.89%
jan 1, 1987
57.108 bln
+1.569 bln
2.83%
jan 1, 1988
60.351 bln
+3.243 bln
5.68%
jan 1, 1989
63.116 bln
+2.765 bln
4.58%
jan 1, 1990
66.184 bln
+3.067 bln
4.86%
jan 1, 1991
70.966 bln
+4.783 bln
7.23%
jan 1, 1992
71.589 bln
+622.627 mln
0.88%
jan 1, 1993
73.229 bln
+1.64 bln
2.29%
jan 1, 1994
76.966 bln
+3.738 bln
5.1%
jan 1, 1995
80.625 bln
+3.659 bln
4.75%
jan 1, 1996
86.475 bln
+5.85 bln
7.26%
jan 1, 1997
94.971 bln
+8.496 bln
9.83%
jan 1, 1998
104.114 bln
+9.143 bln
9.63%
jan 1, 1999
112.514 bln
+8.4 bln
8.07%
jan 1, 2000
120.559 bln
+8.045 bln
7.15%
jan 1, 2001
132.569 bln
+12.01 bln
9.96%
jan 1, 2002
138.144 bln
+5.575 bln
4.21%
jan 1, 2003
143.883 bln
+5.739 bln
4.15%
jan 1, 2004
149.443 bln
+5.559 bln
3.86%
jan 1, 2005
151.049 bln
+1.606 bln
1.07%
jan 1, 2006
160.975 bln
+9.926 bln
6.57%
jan 1, 2007
169.149 bln
+8.174 bln
5.08%
jan 1, 2008
174.691 bln
+5.541 bln
3.28%
jan 1, 2009
170.394 bln
-4.297 bln
-2.46%
jan 1, 2010
152.654 bln
-17.74 bln
-10.41%
jan 1, 2011
153.017 bln
+362.982 mln
0.24%
jan 1, 2012
152.455 bln
-562.116 mln
-0.37%
jan 1, 2013
149.356 bln
-3.099 bln
-2.03%
jan 1, 2014
155.518 bln
+6.162 bln
4.13%
jan 1, 2015
167.567 bln
+12.049 bln
7.75%
Ranking of countries by current statistics by years


Comments: