29
/
en
AIzaSyAYiBZKx7MnpbEhh9jyipgxe19OcubqV5w
April 1, 2024
276325
United States
USA
true
2
1
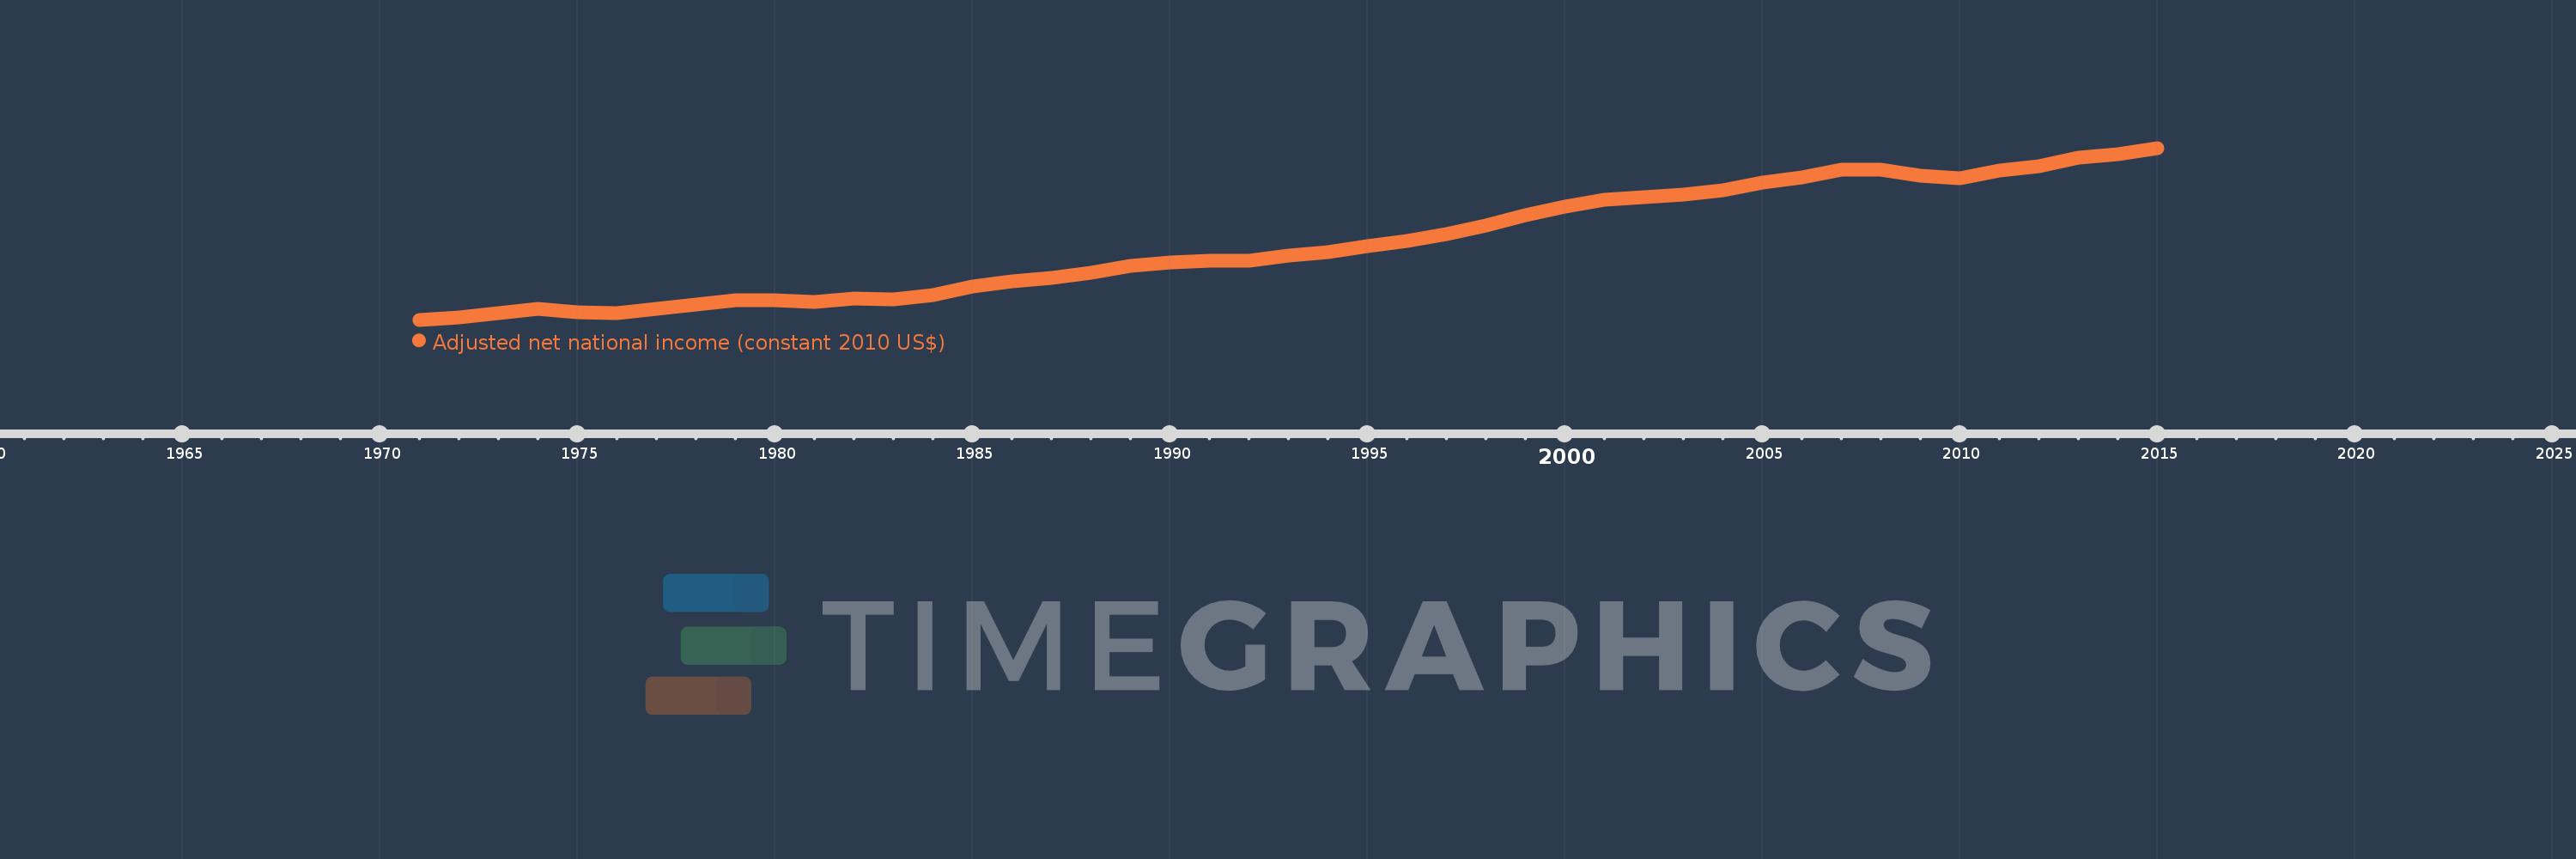
Adjusted net national income (constant 2010 US$)
2015,2014,2013,2012,2011,2010,2009,2008,2007,2006,2005,2004,2003,2002,2001,2000,1999,1998,1997,1996,1995,1994,1993,1992,1991,1990,1989,1988,1987,1986,1985,1984,1983,1982,1981,1980,1979,1978,1977,1976,1975,1974,1973,1972,1971
This statistics in other country:
AfghanistanAlbaniaAlgeriaAngolaArab WorldArgentinaArmeniaAustraliaAustriaAzerbaijanBahamas, TheBahrainBangladeshBarbadosBelarusBelgiumBelizeBeninBhutanBoliviaBotswanaBrazilBulgariaBurkina FasoBurundiCabo VerdeCambodiaCameroonCanadaCaribbean small statesCentral African RepublicCentral Europe and the BalticsChadChileChinaColombiaComorosCongo, Dem. Rep.Congo, Rep.Costa RicaCote d'IvoireCroatiaCubaCyprusCzech RepublicDenmarkDominicaDominican RepublicEarly-demographic dividendEast Asia & PacificEast Asia & Pacific (excluding high income)East Asia & Pacific (IDA & IBRD countries)EcuadorEgypt, Arab Rep.El SalvadorEritreaEstoniaEthiopiaEuro areaEurope & Central AsiaEurope & Central Asia (excluding high income)Europe & Central Asia (IDA & IBRD countries)European UnionFijiFinlandFragile and conflict affected situationsFranceGabonGambia, TheGeorgiaGermanyGhanaGreeceGuatemalaGuineaGuinea-BissauGuyanaHaitiHeavily indebted poor countries (HIPC)High incomeHondurasHungaryIBRD onlyIDA & IBRD totalIDA blendIDA onlyIDA totalIndiaIndonesiaIran, Islamic Rep.IraqIrelandIsraelItalyJamaicaJapanJordanKazakhstanKenyaKiribatiKorea, Rep.KuwaitKyrgyz RepublicLao PDRLate-demographic dividendLatin America & Caribbean Latin America & Caribbean (excluding high income)Latin America & the Caribbean (IDA & IBRD countries)LatviaLeast developed countries: UN classificationLebanonLesothoLiberiaLibyaLithuaniaLow & middle incomeLow incomeLower middle incomeLuxembourgMacedonia, FYRMadagascarMalawiMalaysiaMaldivesMaliMauritaniaMauritiusMexicoMiddle East & North AfricaMiddle East & North Africa (excluding high income)Middle East & North Africa (IDA & IBRD countries)Middle incomeMoldovaMongoliaMoroccoMozambiqueNamibiaNepalNetherlandsNew ZealandNicaraguaNigerNigeriaNorth AmericaNorwayOECD membersOmanOther small statesPacific island small statesPakistanPanamaPapua New GuineaParaguayPeruPhilippinesPolandPortugalPost-demographic dividendPre-demographic dividendQatarRomaniaRussian FederationRwandaSamoaSao Tome and PrincipeSaudi ArabiaSenegalSeychellesSierra LeoneSingaporeSlovak RepublicSloveniaSmall statesSolomon IslandsSouth AfricaSouth AsiaSouth Asia (IDA & IBRD)SpainSri LankaSt. LuciaSt. Vincent and the GrenadinesSub-Saharan Africa Sub-Saharan Africa (excluding high income)Sub-Saharan Africa (IDA & IBRD countries)SurinameSwazilandSwedenSwitzerlandTajikistanTanzaniaThailandTogoTongaTrinidad and TobagoTunisiaTurkeyTurkmenistanUgandaUkraineUnited Arab EmiratesUnited KingdomUnited StatesUpper middle incomeUruguayUzbekistanVanuatuVenezuela, RBVietnamWorldYemen, Rep.ZambiaZimbabwe Timeline:
This timeline shows a graph from 1971 to 2015 of United States. No data until 1970. Number of actual observations by date: 45.
Source name:
World Development Indicators
Source organization:
World Bank staff estimates based on sources and methods in World Bank's "The Changing Wealth of Nations: Measuring Sustainable Development in the New Millennium" (2011).
Categories, topics:
Economy & Growth
Last updated:
apr 23, 2017
Indicators value changes by year
Minimum:
4.217 trl
jan 1, 1971
Maximum:
13.905 trl
jan 1, 2015
At the date of observation
Value
Absolute change
Change from previous value
jan 1, 1971
4.217 trl
+4.217 trl
0.0%
jan 1, 1972
4.333 trl
+115.329 bln
2.73%
jan 1, 1973
4.584 trl
+251.871 bln
5.81%
jan 1, 1974
4.853 trl
+268.157 bln
5.85%
jan 1, 1975
4.643 trl
-209.639 bln
-4.32%
jan 1, 1976
4.606 trl
-37.387 bln
-0.81%
jan 1, 1977
4.849 trl
+242.997 bln
5.28%
jan 1, 1978
5.06 trl
+211.37 bln
4.36%
jan 1, 1979
5.336 trl
+276.51 bln
5.46%
jan 1, 1980
5.324 trl
-12.664 bln
-0.24%
jan 1, 1981
5.221 trl
-103.181 bln
-1.94%
jan 1, 1982
5.406 trl
+185.754 bln
3.56%
jan 1, 1983
5.361 trl
-44.834 bln
-0.83%
jan 1, 1984
5.613 trl
+251.911 bln
4.7%
jan 1, 1985
6.115 trl
+501.569 bln
8.94%
jan 1, 1986
6.378 trl
+262.813 bln
4.3%
jan 1, 1987
6.598 trl
+220.063 bln
3.45%
jan 1, 1988
6.864 trl
+266.052 bln
4.03%
jan 1, 1989
7.268 trl
+403.688 bln
5.88%
jan 1, 1990
7.453 trl
+185.846 bln
2.56%
jan 1, 1991
7.537 trl
+83.503 bln
1.12%
jan 1, 1992
7.551 trl
+14.044 bln
0.19%
jan 1, 1993
7.837 trl
+286.063 bln
3.79%
jan 1, 1994
8.016 trl
+178.613 bln
2.28%
jan 1, 1995
8.382 trl
+366.82 bln
4.58%
jan 1, 1996
8.661 trl
+278.204 bln
3.32%
jan 1, 1997
9.048 trl
+387.28 bln
4.47%
jan 1, 1998
9.551 trl
+503.535 bln
5.57%
jan 1, 1999
10.134 trl
+582.995 bln
6.1%
jan 1, 2000
10.576 trl
+441.932 bln
4.36%
jan 1, 2001
10.972 trl
+395.728 bln
3.74%
jan 1, 2002
11.114 trl
+142.379 bln
1.3%
jan 1, 2003
11.286 trl
+171.976 bln
1.55%
jan 1, 2004
11.515 trl
+228.759 bln
2.03%
jan 1, 2005
11.942 trl
+426.959 bln
3.71%
jan 1, 2006
12.257 trl
+315.012 bln
2.64%
jan 1, 2007
12.686 trl
+429.025 bln
3.5%
jan 1, 2008
12.67 trl
-15.831 bln
-0.12%
jan 1, 2009
12.317 trl
-353.367 bln
-2.79%
jan 1, 2010
12.212 trl
-104.748 bln
-0.85%
jan 1, 2011
12.62 trl
+408.183 bln
3.34%
jan 1, 2012
12.883 trl
+262.085 bln
2.08%
jan 1, 2013
13.352 trl
+469.571 bln
3.65%
jan 1, 2014
13.53 trl
+178.019 bln
1.33%
jan 1, 2015
13.905 trl
+374.775 bln
2.77%
Ranking of countries by current statistics by years


Comments: