29
/
en
AIzaSyAYiBZKx7MnpbEhh9jyipgxe19OcubqV5w
April 1, 2024
138952
Germany
DEU
true
2
1
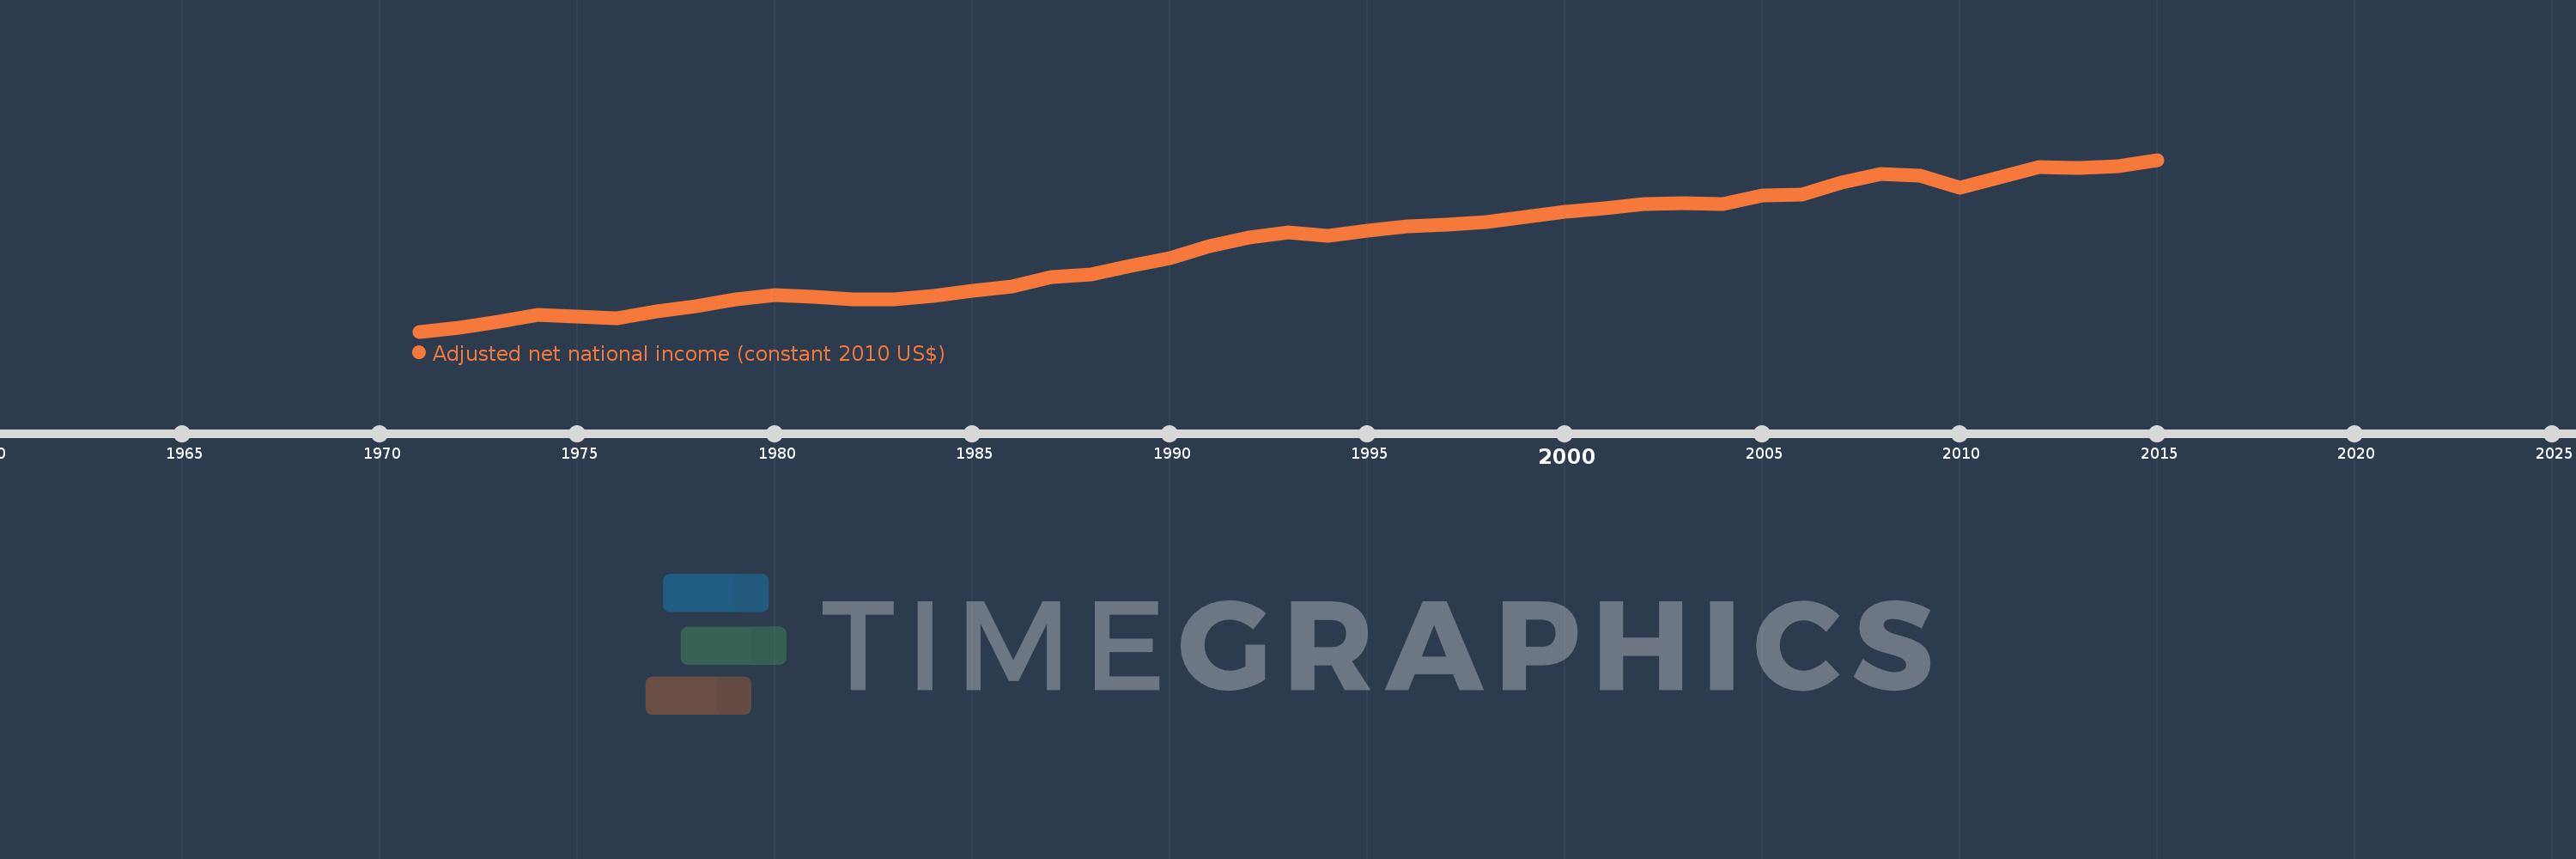
Adjusted net national income (constant 2010 US$)
2015,2014,2013,2012,2011,2010,2009,2008,2007,2006,2005,2004,2003,2002,2001,2000,1999,1998,1997,1996,1995,1994,1993,1992,1991,1990,1989,1988,1987,1986,1985,1984,1983,1982,1981,1980,1979,1978,1977,1976,1975,1974,1973,1972,1971
This statistics in other country:
AfghanistanAlbaniaAlgeriaAngolaArab WorldArgentinaArmeniaAustraliaAustriaAzerbaijanBahamas, TheBahrainBangladeshBarbadosBelarusBelgiumBelizeBeninBhutanBoliviaBotswanaBrazilBulgariaBurkina FasoBurundiCabo VerdeCambodiaCameroonCanadaCaribbean small statesCentral African RepublicCentral Europe and the BalticsChadChileChinaColombiaComorosCongo, Dem. Rep.Congo, Rep.Costa RicaCote d'IvoireCroatiaCubaCyprusCzech RepublicDenmarkDominicaDominican RepublicEarly-demographic dividendEast Asia & PacificEast Asia & Pacific (excluding high income)East Asia & Pacific (IDA & IBRD countries)EcuadorEgypt, Arab Rep.El SalvadorEritreaEstoniaEthiopiaEuro areaEurope & Central AsiaEurope & Central Asia (excluding high income)Europe & Central Asia (IDA & IBRD countries)European UnionFijiFinlandFragile and conflict affected situationsFranceGabonGambia, TheGeorgiaGermanyGhanaGreeceGuatemalaGuineaGuinea-BissauGuyanaHaitiHeavily indebted poor countries (HIPC)High incomeHondurasHungaryIBRD onlyIDA & IBRD totalIDA blendIDA onlyIDA totalIndiaIndonesiaIran, Islamic Rep.IraqIrelandIsraelItalyJamaicaJapanJordanKazakhstanKenyaKiribatiKorea, Rep.KuwaitKyrgyz RepublicLao PDRLate-demographic dividendLatin America & Caribbean Latin America & Caribbean (excluding high income)Latin America & the Caribbean (IDA & IBRD countries)LatviaLeast developed countries: UN classificationLebanonLesothoLiberiaLibyaLithuaniaLow & middle incomeLow incomeLower middle incomeLuxembourgMacedonia, FYRMadagascarMalawiMalaysiaMaldivesMaliMauritaniaMauritiusMexicoMiddle East & North AfricaMiddle East & North Africa (excluding high income)Middle East & North Africa (IDA & IBRD countries)Middle incomeMoldovaMongoliaMoroccoMozambiqueNamibiaNepalNetherlandsNew ZealandNicaraguaNigerNigeriaNorth AmericaNorwayOECD membersOmanOther small statesPacific island small statesPakistanPanamaPapua New GuineaParaguayPeruPhilippinesPolandPortugalPost-demographic dividendPre-demographic dividendQatarRomaniaRussian FederationRwandaSamoaSao Tome and PrincipeSaudi ArabiaSenegalSeychellesSierra LeoneSingaporeSlovak RepublicSloveniaSmall statesSolomon IslandsSouth AfricaSouth AsiaSouth Asia (IDA & IBRD)SpainSri LankaSt. LuciaSt. Vincent and the GrenadinesSub-Saharan Africa Sub-Saharan Africa (excluding high income)Sub-Saharan Africa (IDA & IBRD countries)SurinameSwazilandSwedenSwitzerlandTajikistanTanzaniaThailandTogoTongaTrinidad and TobagoTunisiaTurkeyTurkmenistanUgandaUkraineUnited Arab EmiratesUnited KingdomUnited StatesUpper middle incomeUruguayUzbekistanVanuatuVenezuela, RBVietnamWorldYemen, Rep.ZambiaZimbabwe Timeline:
This timeline shows a graph from 1971 to 2015 of Germany. No data until 1970. Number of actual observations by date: 45.
Source name:
World Development Indicators
Source organization:
World Bank staff estimates based on sources and methods in World Bank's "The Changing Wealth of Nations: Measuring Sustainable Development in the New Millennium" (2011).
Categories, topics:
Economy & Growth
Last updated:
apr 23, 2017
Indicators value changes by year
Minimum:
1.347 trl
jan 1, 1971
Maximum:
3.049 trl
jan 1, 2015
At the date of observation
Value
Absolute change
Change from previous value
jan 1, 1971
1.347 trl
+1.347 trl
0.0%
jan 1, 1972
1.385 trl
+37.863 bln
2.81%
jan 1, 1973
1.442 trl
+57.289 bln
4.14%
jan 1, 1974
1.51 trl
+67.428 bln
4.67%
jan 1, 1975
1.499 trl
-11.193 bln
-0.74%
jan 1, 1976
1.479 trl
-19.971 bln
-1.33%
jan 1, 1977
1.55 trl
+71.622 bln
4.84%
jan 1, 1978
1.6 trl
+50.02 bln
3.23%
jan 1, 1979
1.663 trl
+62.456 bln
3.9%
jan 1, 1980
1.705 trl
+42.22 bln
2.54%
jan 1, 1981
1.695 trl
-10.296 bln
-0.6%
jan 1, 1982
1.67 trl
-24.601 bln
-1.45%
jan 1, 1983
1.663 trl
-7.225 bln
-0.43%
jan 1, 1984
1.701 trl
+38.439 bln
2.31%
jan 1, 1985
1.75 trl
+49.087 bln
2.89%
jan 1, 1986
1.795 trl
+44.626 bln
2.55%
jan 1, 1987
1.884 trl
+88.502 bln
4.93%
jan 1, 1988
1.916 trl
+32.755 bln
1.74%
jan 1, 1989
2.001 trl
+85.154 bln
4.44%
jan 1, 1990
2.074 trl
+72.087 bln
3.6%
jan 1, 1991
2.19 trl
+116.857 bln
5.64%
jan 1, 1992
2.278 trl
+87.545 bln
4.0%
jan 1, 1993
2.33 trl
+52.465 bln
2.3%
jan 1, 1994
2.294 trl
-36.195 bln
-1.55%
jan 1, 1995
2.348 trl
+53.623 bln
2.34%
jan 1, 1996
2.39 trl
+42.04 bln
1.79%
jan 1, 1997
2.407 trl
+17.013 bln
0.71%
jan 1, 1998
2.435 trl
+28.586 bln
1.19%
jan 1, 1999
2.486 trl
+50.063 bln
2.06%
jan 1, 2000
2.533 trl
+47.638 bln
1.92%
jan 1, 2001
2.572 trl
+39.281 bln
1.55%
jan 1, 2002
2.613 trl
+40.191 bln
1.56%
jan 1, 2003
2.616 trl
+2.917 bln
0.11%
jan 1, 2004
2.608 trl
-7.521 bln
-0.29%
jan 1, 2005
2.695 trl
+87.327 bln
3.35%
jan 1, 2006
2.703 trl
+7.271 bln
0.27%
jan 1, 2007
2.824 trl
+121.218 bln
4.49%
jan 1, 2008
2.908 trl
+84.265 bln
2.98%
jan 1, 2009
2.888 trl
-19.835 bln
-0.68%
jan 1, 2010
2.773 trl
-114.781 bln
-3.97%
jan 1, 2011
2.873 trl
+99.224 bln
3.58%
jan 1, 2012
2.973 trl
+100.645 bln
3.5%
jan 1, 2013
2.969 trl
-4.192 bln
-0.14%
jan 1, 2014
2.982 trl
+12.411 bln
0.42%
jan 1, 2015
3.049 trl
+67.804 bln
2.27%
Ranking of countries by current statistics by years


Comments: