29
/
en
AIzaSyAYiBZKx7MnpbEhh9jyipgxe19OcubqV5w
April 1, 2024
192667
Mauritania
MRT
true
2
1
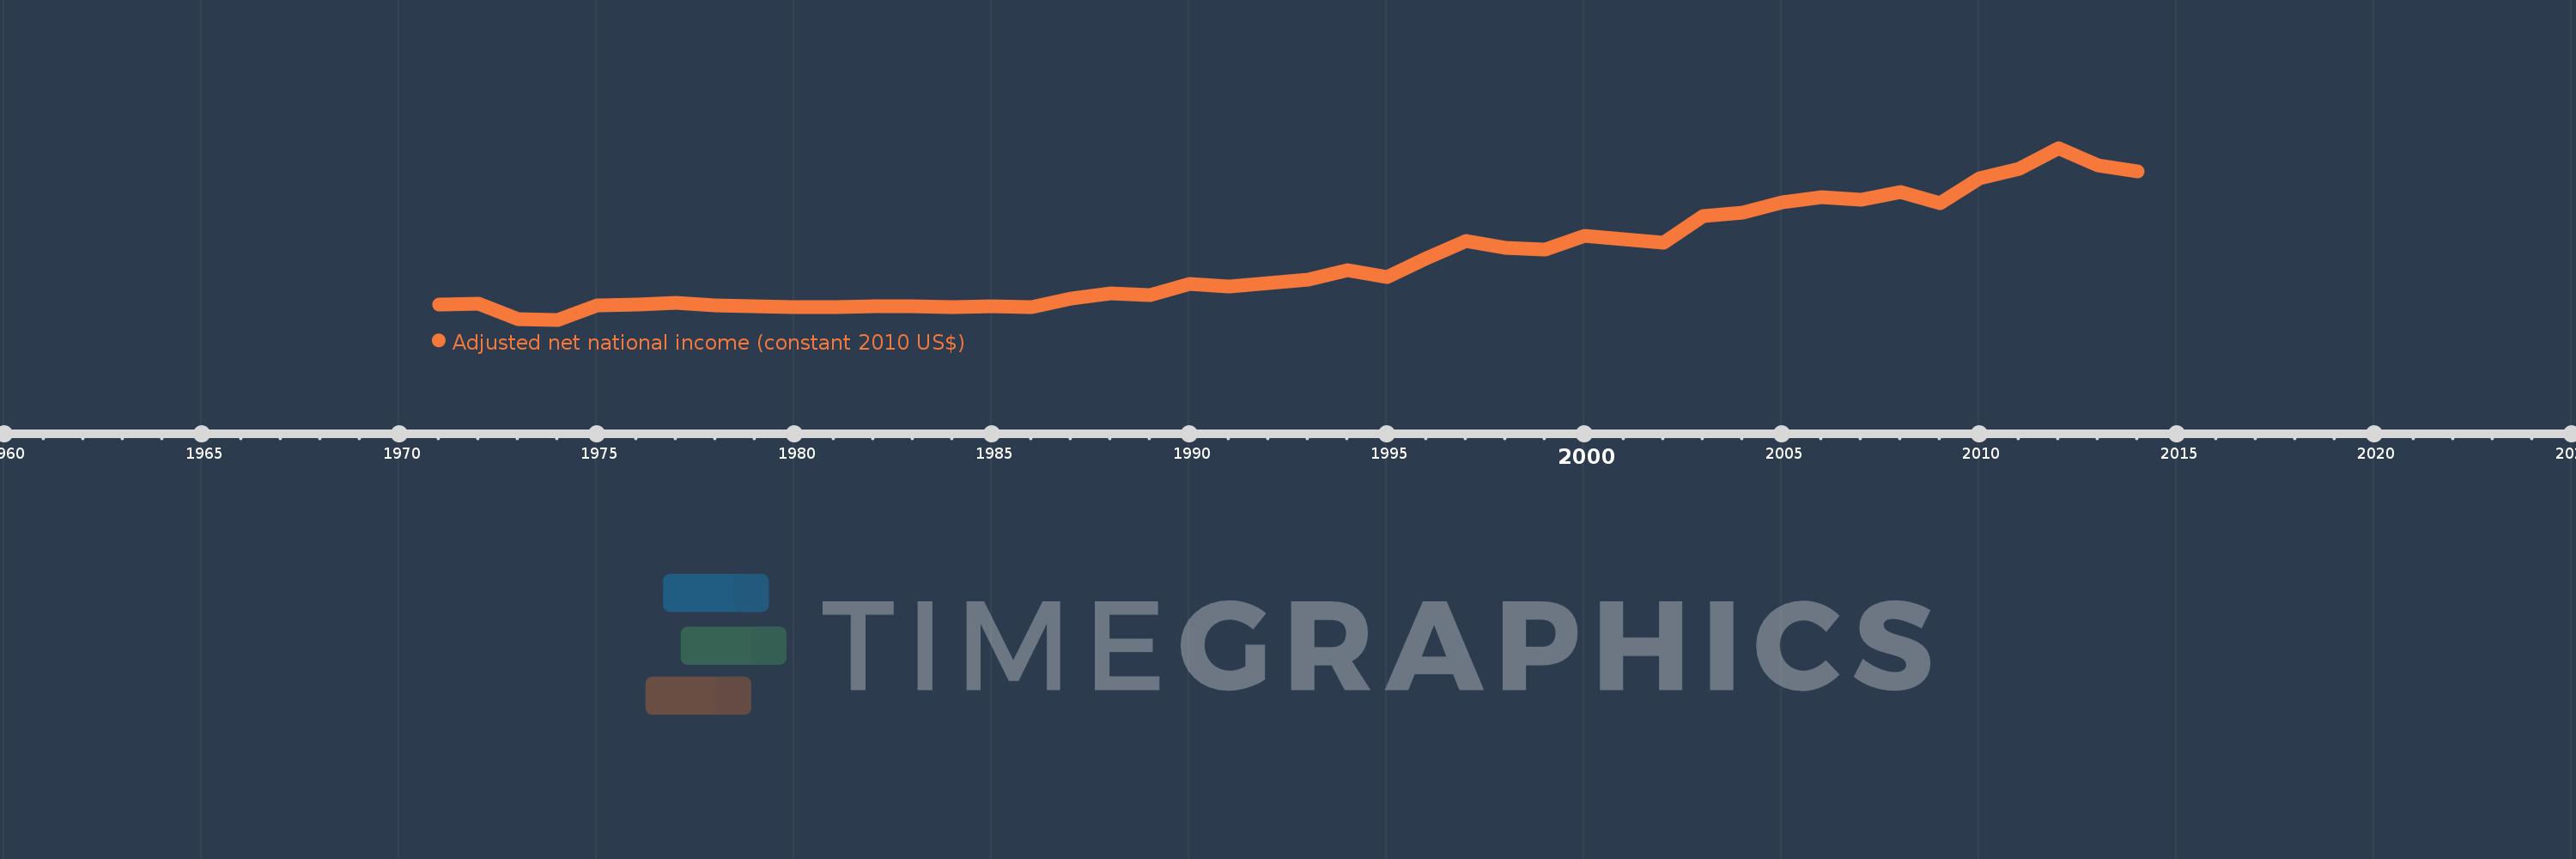
Adjusted net national income (constant 2010 US$)
2014,2013,2012,2011,2010,2009,2008,2007,2006,2005,2004,2003,2002,2001,2000,1999,1998,1997,1996,1995,1994,1993,1992,1991,1990,1989,1988,1987,1986,1985,1984,1983,1982,1981,1980,1979,1978,1977,1976,1975,1974,1973,1972,1971
This statistics in other country:
AfghanistanAlbaniaAlgeriaAngolaArab WorldArgentinaArmeniaAustraliaAustriaAzerbaijanBahamas, TheBahrainBangladeshBarbadosBelarusBelgiumBelizeBeninBhutanBoliviaBotswanaBrazilBulgariaBurkina FasoBurundiCabo VerdeCambodiaCameroonCanadaCaribbean small statesCentral African RepublicCentral Europe and the BalticsChadChileChinaColombiaComorosCongo, Dem. Rep.Congo, Rep.Costa RicaCote d'IvoireCroatiaCubaCyprusCzech RepublicDenmarkDominicaDominican RepublicEarly-demographic dividendEast Asia & PacificEast Asia & Pacific (excluding high income)East Asia & Pacific (IDA & IBRD countries)EcuadorEgypt, Arab Rep.El SalvadorEritreaEstoniaEthiopiaEuro areaEurope & Central AsiaEurope & Central Asia (excluding high income)Europe & Central Asia (IDA & IBRD countries)European UnionFijiFinlandFragile and conflict affected situationsFranceGabonGambia, TheGeorgiaGermanyGhanaGreeceGuatemalaGuineaGuinea-BissauGuyanaHaitiHeavily indebted poor countries (HIPC)High incomeHondurasHungaryIBRD onlyIDA & IBRD totalIDA blendIDA onlyIDA totalIndiaIndonesiaIran, Islamic Rep.IraqIrelandIsraelItalyJamaicaJapanJordanKazakhstanKenyaKiribatiKorea, Rep.KuwaitKyrgyz RepublicLao PDRLate-demographic dividendLatin America & Caribbean Latin America & Caribbean (excluding high income)Latin America & the Caribbean (IDA & IBRD countries)LatviaLeast developed countries: UN classificationLebanonLesothoLiberiaLibyaLithuaniaLow & middle incomeLow incomeLower middle incomeLuxembourgMacedonia, FYRMadagascarMalawiMalaysiaMaldivesMaliMauritaniaMauritiusMexicoMiddle East & North AfricaMiddle East & North Africa (excluding high income)Middle East & North Africa (IDA & IBRD countries)Middle incomeMoldovaMongoliaMoroccoMozambiqueNamibiaNepalNetherlandsNew ZealandNicaraguaNigerNigeriaNorth AmericaNorwayOECD membersOmanOther small statesPacific island small statesPakistanPanamaPapua New GuineaParaguayPeruPhilippinesPolandPortugalPost-demographic dividendPre-demographic dividendQatarRomaniaRussian FederationRwandaSamoaSao Tome and PrincipeSaudi ArabiaSenegalSeychellesSierra LeoneSingaporeSlovak RepublicSloveniaSmall statesSolomon IslandsSouth AfricaSouth AsiaSouth Asia (IDA & IBRD)SpainSri LankaSt. LuciaSt. Vincent and the GrenadinesSub-Saharan Africa Sub-Saharan Africa (excluding high income)Sub-Saharan Africa (IDA & IBRD countries)SurinameSwazilandSwedenSwitzerlandTajikistanTanzaniaThailandTogoTongaTrinidad and TobagoTunisiaTurkeyTurkmenistanUgandaUkraineUnited Arab EmiratesUnited KingdomUnited StatesUpper middle incomeUruguayUzbekistanVanuatuVenezuela, RBVietnamWorldYemen, Rep.ZambiaZimbabwe Timeline:
This timeline shows a graph from 1971 to 2014 of Mauritania. No data until 1970. Number of actual observations by date: 44.
Source name:
World Development Indicators
Source organization:
World Bank staff estimates based on sources and methods in World Bank's "The Changing Wealth of Nations: Measuring Sustainable Development in the New Millennium" (2011).
Categories, topics:
Economy & Growth
Last updated:
apr 23, 2017
Indicators value changes by year
Minimum:
771.946 mln
jan 1, 1974
Maximum:
2.921 bln
jan 1, 2012
At the date of observation
Value
Absolute change
Change from previous value
jan 1, 1971
964.886 mln
+964.886 mln
0.0%
jan 1, 1972
969.512 mln
+4.626 mln
0.48%
jan 1, 1973
777.34 mln
-192.172 mln
-19.82%
jan 1, 1974
771.946 mln
-5.394 mln
-0.69%
jan 1, 1975
949.034 mln
+177.088 mln
22.94%
jan 1, 1976
964.631 mln
+15.597 mln
1.64%
jan 1, 1977
984.705 mln
+20.074 mln
2.08%
jan 1, 1978
955.432 mln
-29.273 mln
-2.97%
jan 1, 1979
935.618 mln
-19.814 mln
-2.07%
jan 1, 1980
933.67 mln
-1.948 mln
-0.21%
jan 1, 1981
929.951 mln
-3.719 mln
-0.4%
jan 1, 1982
945.115 mln
+15.164 mln
1.63%
jan 1, 1983
937.404 mln
-7.712 mln
-0.82%
jan 1, 1984
929.792 mln
-7.612 mln
-0.81%
jan 1, 1985
941.157 mln
+11.365 mln
1.22%
jan 1, 1986
931.844 mln
-9.313 mln
-0.99%
jan 1, 1987
1.037 bln
+104.883 mln
11.26%
jan 1, 1988
1.098 bln
+61.178 mln
5.9%
jan 1, 1989
1.08 bln
-17.452 mln
-1.59%
jan 1, 1990
1.218 bln
+137.197 mln
12.7%
jan 1, 1991
1.19 bln
-27.224 mln
-2.24%
jan 1, 1992
1.227 bln
+36.532 mln
3.07%
jan 1, 1993
1.27 bln
+42.638 mln
3.48%
jan 1, 1994
1.391 bln
+121.671 mln
9.58%
jan 1, 1995
1.308 bln
-82.974 mln
-5.96%
jan 1, 1996
1.544 bln
+236.184 mln
18.05%
jan 1, 1997
1.759 bln
+214.038 mln
13.86%
jan 1, 1998
1.67 bln
-88.489 mln
-5.03%
jan 1, 1999
1.645 bln
-25.059 mln
-1.5%
jan 1, 2000
1.826 bln
+180.939 mln
11.0%
jan 1, 2001
1.782 bln
-43.77 mln
-2.4%
jan 1, 2002
1.741 bln
-41.133 mln
-2.31%
jan 1, 2003
2.072 bln
+331.456 mln
19.04%
jan 1, 2004
2.113 bln
+40.548 mln
1.96%
jan 1, 2005
2.243 bln
+129.91 mln
6.15%
jan 1, 2006
2.303 bln
+60.46 mln
2.7%
jan 1, 2007
2.27 bln
-33.636 mln
-1.46%
jan 1, 2008
2.367 bln
+97.307 mln
4.29%
jan 1, 2009
2.234 bln
-132.683 mln
-5.61%
jan 1, 2010
2.542 bln
+308.003 mln
13.78%
jan 1, 2011
2.655 bln
+113.046 mln
4.45%
jan 1, 2012
2.921 bln
+265.356 mln
9.99%
jan 1, 2013
2.706 bln
-214.711 mln
-7.35%
jan 1, 2014
2.629 bln
-77.485 mln
-2.86%
Ranking of countries by current statistics by years


Comments: