29
/
en
AIzaSyAYiBZKx7MnpbEhh9jyipgxe19OcubqV5w
April 1, 2024
271810
Uganda
UGA
true
2
1
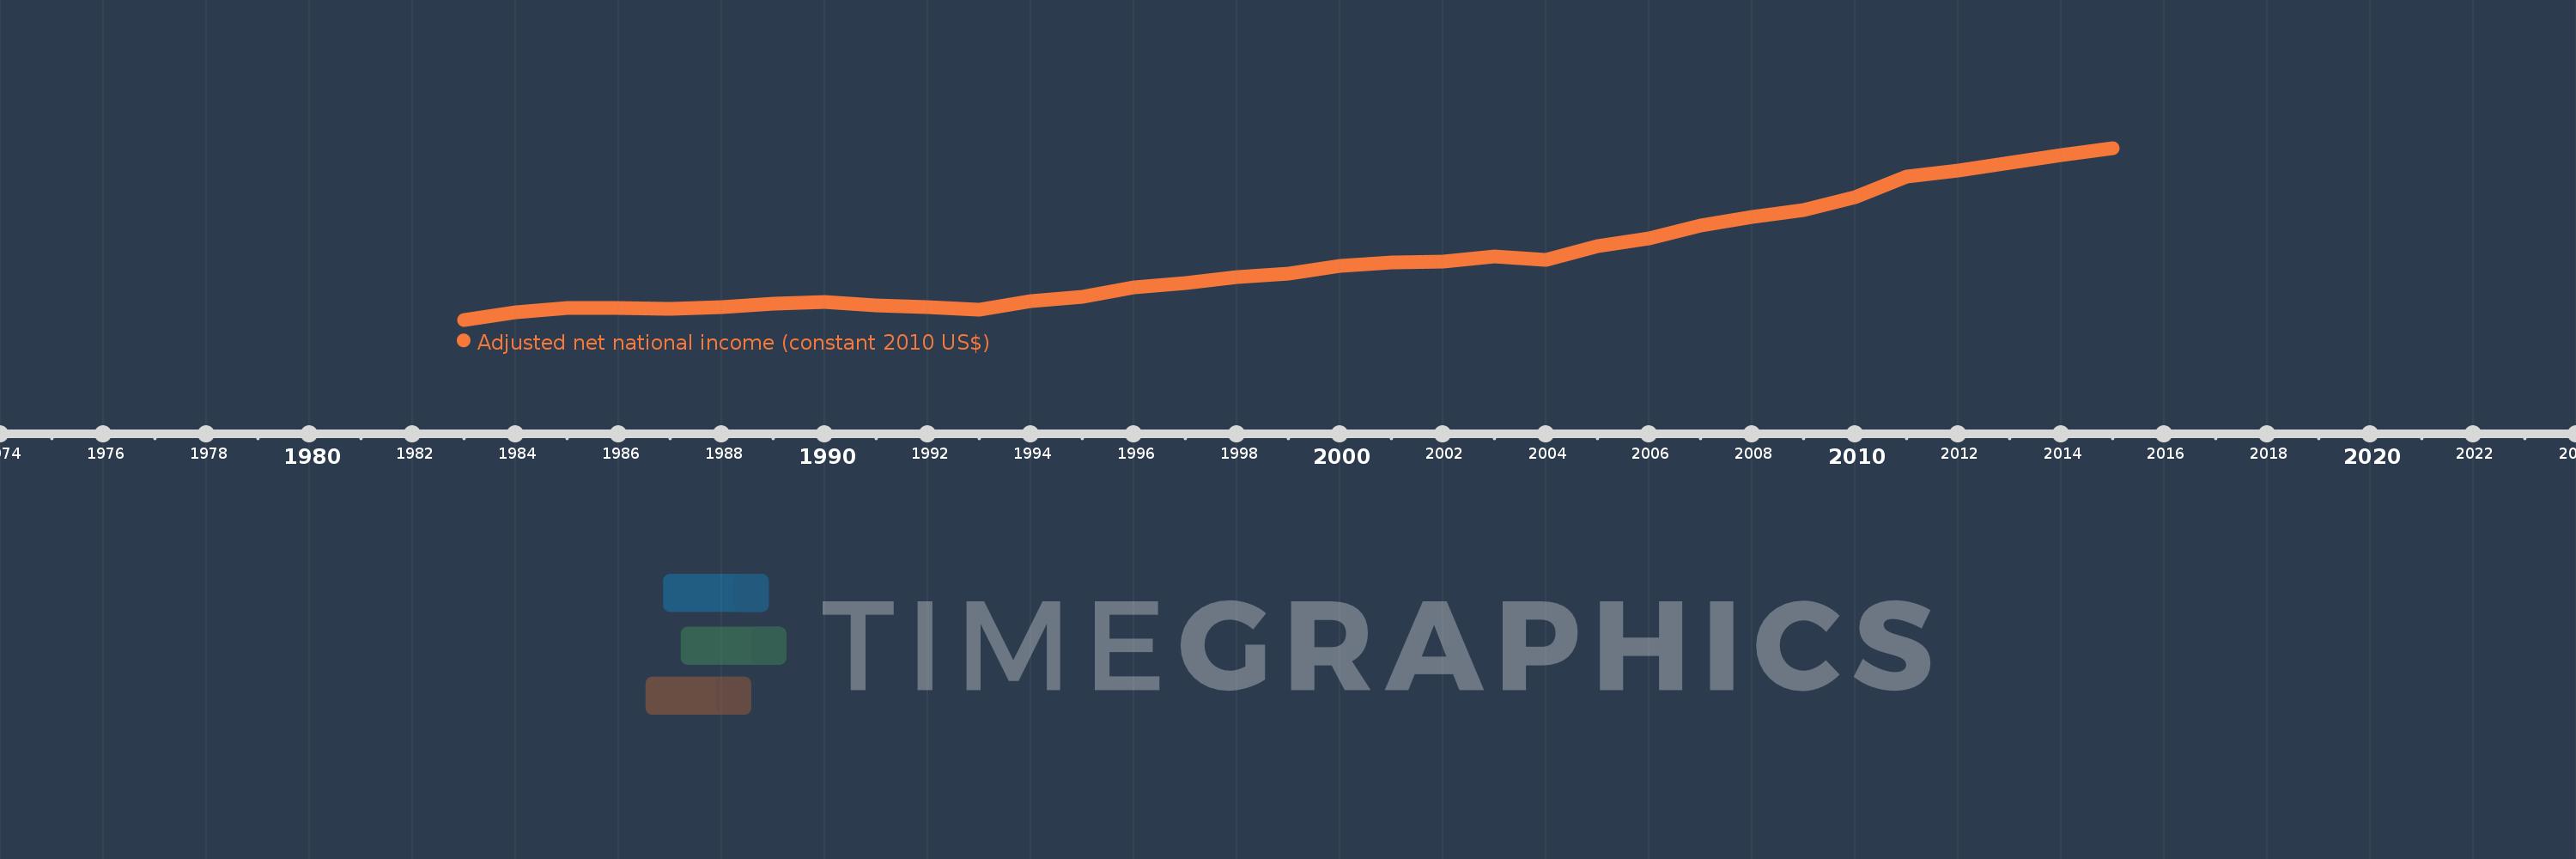
Adjusted net national income (constant 2010 US$)
2015,2014,2013,2012,2011,2010,2009,2008,2007,2006,2005,2004,2003,2002,2001,2000,1999,1998,1997,1996,1995,1994,1993,1992,1991,1990,1989,1988,1987,1986,1985,1984,1983
This statistics in other country:
AfghanistanAlbaniaAlgeriaAngolaArab WorldArgentinaArmeniaAustraliaAustriaAzerbaijanBahamas, TheBahrainBangladeshBarbadosBelarusBelgiumBelizeBeninBhutanBoliviaBotswanaBrazilBulgariaBurkina FasoBurundiCabo VerdeCambodiaCameroonCanadaCaribbean small statesCentral African RepublicCentral Europe and the BalticsChadChileChinaColombiaComorosCongo, Dem. Rep.Congo, Rep.Costa RicaCote d'IvoireCroatiaCubaCyprusCzech RepublicDenmarkDominicaDominican RepublicEarly-demographic dividendEast Asia & PacificEast Asia & Pacific (excluding high income)East Asia & Pacific (IDA & IBRD countries)EcuadorEgypt, Arab Rep.El SalvadorEritreaEstoniaEthiopiaEuro areaEurope & Central AsiaEurope & Central Asia (excluding high income)Europe & Central Asia (IDA & IBRD countries)European UnionFijiFinlandFragile and conflict affected situationsFranceGabonGambia, TheGeorgiaGermanyGhanaGreeceGuatemalaGuineaGuinea-BissauGuyanaHaitiHeavily indebted poor countries (HIPC)High incomeHondurasHungaryIBRD onlyIDA & IBRD totalIDA blendIDA onlyIDA totalIndiaIndonesiaIran, Islamic Rep.IraqIrelandIsraelItalyJamaicaJapanJordanKazakhstanKenyaKiribatiKorea, Rep.KuwaitKyrgyz RepublicLao PDRLate-demographic dividendLatin America & Caribbean Latin America & Caribbean (excluding high income)Latin America & the Caribbean (IDA & IBRD countries)LatviaLeast developed countries: UN classificationLebanonLesothoLiberiaLibyaLithuaniaLow & middle incomeLow incomeLower middle incomeLuxembourgMacedonia, FYRMadagascarMalawiMalaysiaMaldivesMaliMauritaniaMauritiusMexicoMiddle East & North AfricaMiddle East & North Africa (excluding high income)Middle East & North Africa (IDA & IBRD countries)Middle incomeMoldovaMongoliaMoroccoMozambiqueNamibiaNepalNetherlandsNew ZealandNicaraguaNigerNigeriaNorth AmericaNorwayOECD membersOmanOther small statesPacific island small statesPakistanPanamaPapua New GuineaParaguayPeruPhilippinesPolandPortugalPost-demographic dividendPre-demographic dividendQatarRomaniaRussian FederationRwandaSamoaSao Tome and PrincipeSaudi ArabiaSenegalSeychellesSierra LeoneSingaporeSlovak RepublicSloveniaSmall statesSolomon IslandsSouth AfricaSouth AsiaSouth Asia (IDA & IBRD)SpainSri LankaSt. LuciaSt. Vincent and the GrenadinesSub-Saharan Africa Sub-Saharan Africa (excluding high income)Sub-Saharan Africa (IDA & IBRD countries)SurinameSwazilandSwedenSwitzerlandTajikistanTanzaniaThailandTogoTongaTrinidad and TobagoTunisiaTurkeyTurkmenistanUgandaUkraineUnited Arab EmiratesUnited KingdomUnited StatesUpper middle incomeUruguayUzbekistanVanuatuVenezuela, RBVietnamWorldYemen, Rep.ZambiaZimbabwe Timeline:
This timeline shows a graph from 1983 to 2015 of Uganda. No data until 1982. Number of actual observations by date: 33.
Source name:
World Development Indicators
Source organization:
World Bank staff estimates based on sources and methods in World Bank's "The Changing Wealth of Nations: Measuring Sustainable Development in the New Millennium" (2011).
Categories, topics:
Economy & Growth
Last updated:
apr 23, 2017
Indicators value changes by year
Minimum:
2.676 bln
jan 1, 1983
Maximum:
19.555 bln
jan 1, 2015
At the date of observation
Value
Absolute change
Change from previous value
jan 1, 1983
2.676 bln
+2.676 bln
0.0%
jan 1, 1984
3.437 bln
+760.332 mln
28.41%
jan 1, 1985
3.845 bln
+408.007 mln
11.87%
jan 1, 1986
3.853 bln
+8.447 mln
0.22%
jan 1, 1987
3.709 bln
-144.298 mln
-3.75%
jan 1, 1988
3.931 bln
+221.998 mln
5.99%
jan 1, 1989
4.263 bln
+332.524 mln
8.46%
jan 1, 1990
4.399 bln
+135.632 mln
3.18%
jan 1, 1991
4.125 bln
-274.048 mln
-6.23%
jan 1, 1992
3.952 bln
-173.268 mln
-4.2%
jan 1, 1993
3.67 bln
-281.388 mln
-7.12%
jan 1, 1994
4.467 bln
+796.885 mln
21.71%
jan 1, 1995
4.909 bln
+442.144 mln
9.9%
jan 1, 1996
5.855 bln
+945.953 mln
19.27%
jan 1, 1997
6.302 bln
+446.345 mln
7.62%
jan 1, 1998
6.898 bln
+596.319 mln
9.46%
jan 1, 1999
7.177 bln
+279.389 mln
4.05%
jan 1, 2000
8.008 bln
+831.025 mln
11.58%
jan 1, 2001
8.318 bln
+309.315 mln
3.86%
jan 1, 2002
8.413 bln
+95.268 mln
1.15%
jan 1, 2003
8.89 bln
+477.44 mln
5.68%
jan 1, 2004
8.522 bln
-367.99 mln
-4.14%
jan 1, 2005
9.927 bln
+1.405 bln
16.49%
jan 1, 2006
10.661 bln
+733.846 mln
7.39%
jan 1, 2007
11.961 bln
+1.3 bln
12.19%
jan 1, 2008
12.802 bln
+840.788 mln
7.03%
jan 1, 2009
13.487 bln
+685.193 mln
5.35%
jan 1, 2010
14.758 bln
+1.271 bln
9.43%
jan 1, 2011
16.759 bln
+2.001 bln
13.56%
jan 1, 2012
17.328 bln
+569.304 mln
3.4%
jan 1, 2013
18.131 bln
+802.905 mln
4.63%
jan 1, 2014
18.823 bln
+691.94 mln
3.82%
jan 1, 2015
19.555 bln
+732.401 mln
3.89%
Ranking of countries by current statistics by years


Comments: