29
/
en
AIzaSyAYiBZKx7MnpbEhh9jyipgxe19OcubqV5w
April 1, 2024
286776
Zimbabwe
ZWE
true
2
1
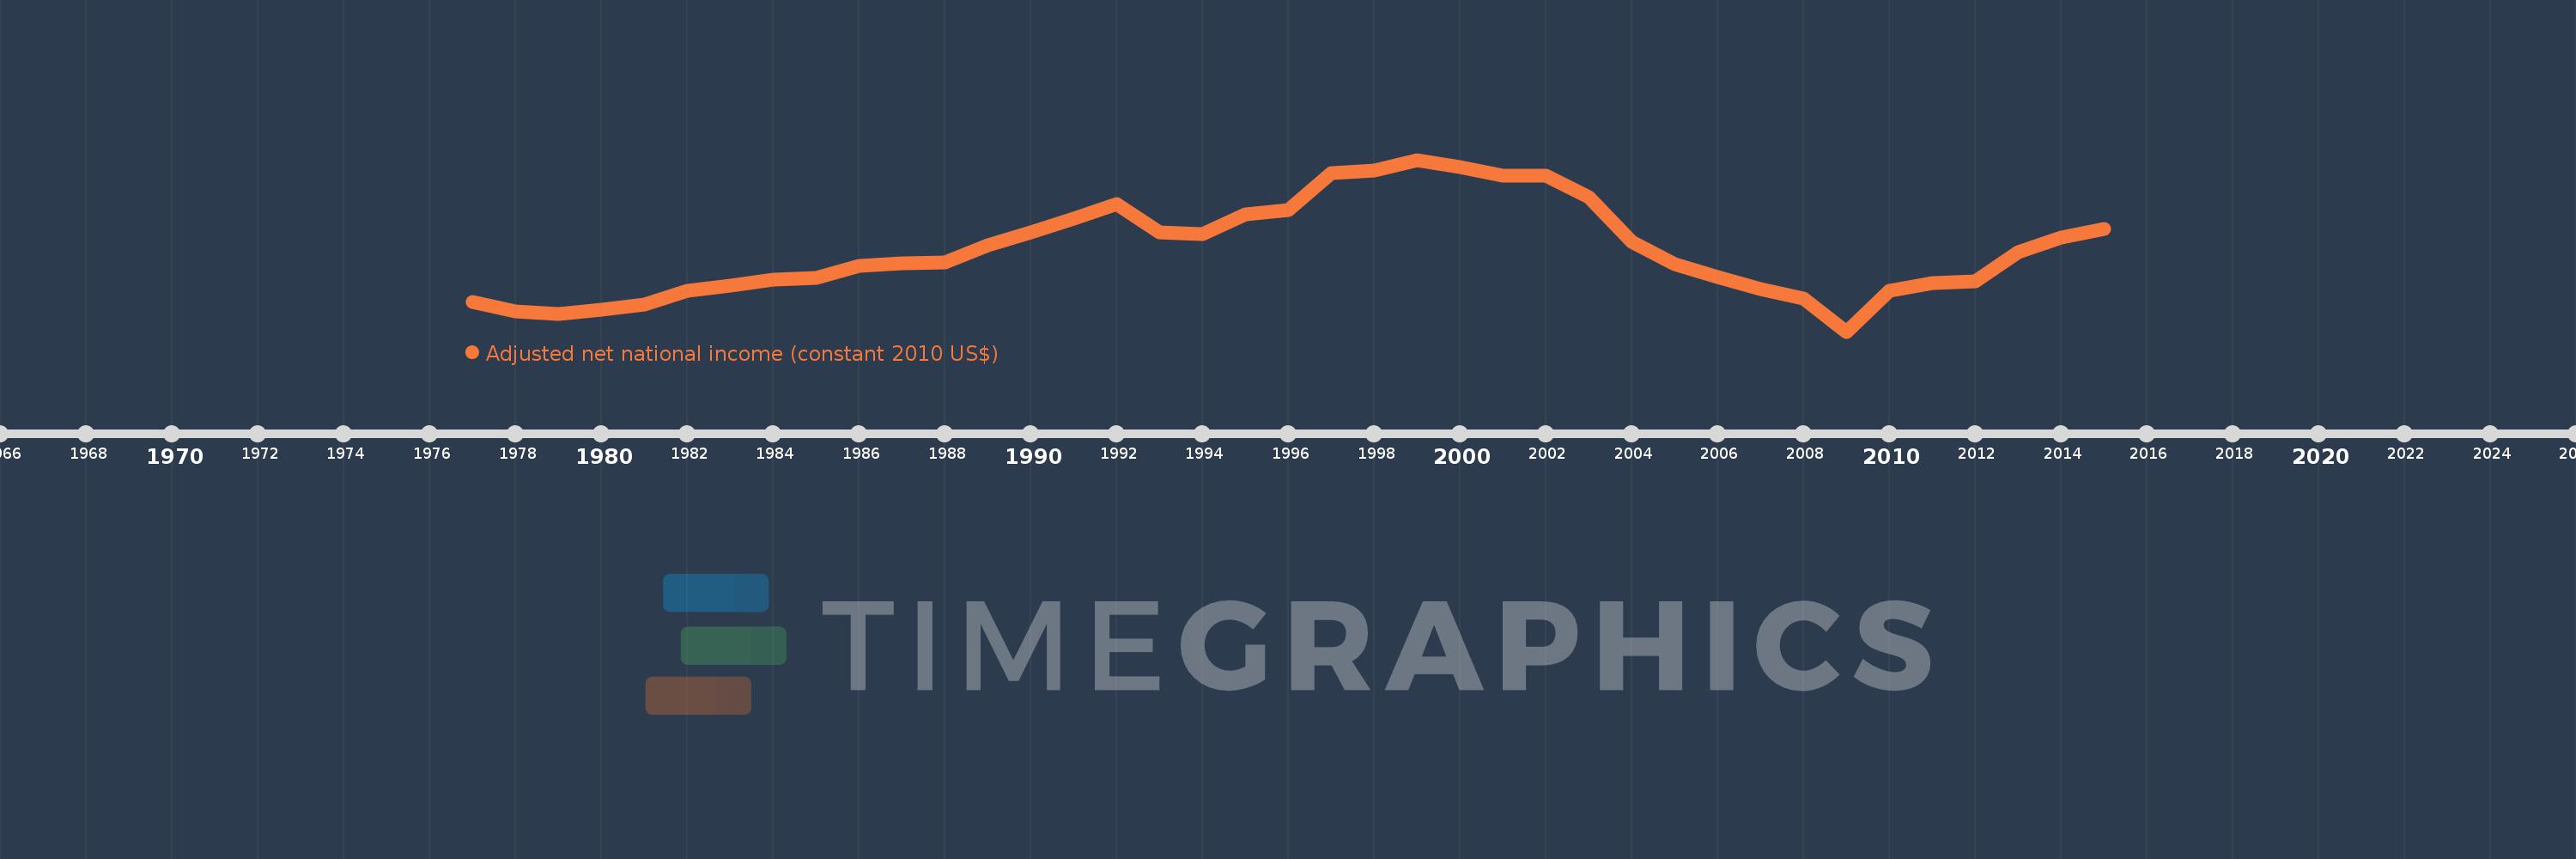
Adjusted net national income (constant 2010 US$)
2015,2014,2013,2012,2011,2010,2009,2008,2007,2006,2005,2004,2003,2002,2001,2000,1999,1998,1997,1996,1995,1994,1993,1992,1991,1990,1989,1988,1987,1986,1985,1984,1983,1982,1981,1980,1979,1978,1977
This statistics in other country:
AfghanistanAlbaniaAlgeriaAngolaArab WorldArgentinaArmeniaAustraliaAustriaAzerbaijanBahamas, TheBahrainBangladeshBarbadosBelarusBelgiumBelizeBeninBhutanBoliviaBotswanaBrazilBulgariaBurkina FasoBurundiCabo VerdeCambodiaCameroonCanadaCaribbean small statesCentral African RepublicCentral Europe and the BalticsChadChileChinaColombiaComorosCongo, Dem. Rep.Congo, Rep.Costa RicaCote d'IvoireCroatiaCubaCyprusCzech RepublicDenmarkDominicaDominican RepublicEarly-demographic dividendEast Asia & PacificEast Asia & Pacific (excluding high income)East Asia & Pacific (IDA & IBRD countries)EcuadorEgypt, Arab Rep.El SalvadorEritreaEstoniaEthiopiaEuro areaEurope & Central AsiaEurope & Central Asia (excluding high income)Europe & Central Asia (IDA & IBRD countries)European UnionFijiFinlandFragile and conflict affected situationsFranceGabonGambia, TheGeorgiaGermanyGhanaGreeceGuatemalaGuineaGuinea-BissauGuyanaHaitiHeavily indebted poor countries (HIPC)High incomeHondurasHungaryIBRD onlyIDA & IBRD totalIDA blendIDA onlyIDA totalIndiaIndonesiaIran, Islamic Rep.IraqIrelandIsraelItalyJamaicaJapanJordanKazakhstanKenyaKiribatiKorea, Rep.KuwaitKyrgyz RepublicLao PDRLate-demographic dividendLatin America & Caribbean Latin America & Caribbean (excluding high income)Latin America & the Caribbean (IDA & IBRD countries)LatviaLeast developed countries: UN classificationLebanonLesothoLiberiaLibyaLithuaniaLow & middle incomeLow incomeLower middle incomeLuxembourgMacedonia, FYRMadagascarMalawiMalaysiaMaldivesMaliMauritaniaMauritiusMexicoMiddle East & North AfricaMiddle East & North Africa (excluding high income)Middle East & North Africa (IDA & IBRD countries)Middle incomeMoldovaMongoliaMoroccoMozambiqueNamibiaNepalNetherlandsNew ZealandNicaraguaNigerNigeriaNorth AmericaNorwayOECD membersOmanOther small statesPacific island small statesPakistanPanamaPapua New GuineaParaguayPeruPhilippinesPolandPortugalPost-demographic dividendPre-demographic dividendQatarRomaniaRussian FederationRwandaSamoaSao Tome and PrincipeSaudi ArabiaSenegalSeychellesSierra LeoneSingaporeSlovak RepublicSloveniaSmall statesSolomon IslandsSouth AfricaSouth AsiaSouth Asia (IDA & IBRD)SpainSri LankaSt. LuciaSt. Vincent and the GrenadinesSub-Saharan Africa Sub-Saharan Africa (excluding high income)Sub-Saharan Africa (IDA & IBRD countries)SurinameSwazilandSwedenSwitzerlandTajikistanTanzaniaThailandTogoTongaTrinidad and TobagoTunisiaTurkeyTurkmenistanUgandaUkraineUnited Arab EmiratesUnited KingdomUnited StatesUpper middle incomeUruguayUzbekistanVanuatuVenezuela, RBVietnamWorldYemen, Rep.ZambiaZimbabwe Timeline:
This timeline shows a graph from 1977 to 2015 of Zimbabwe. No data until 1976. Number of actual observations by date: 39.
Source name:
World Development Indicators
Source organization:
World Bank staff estimates based on sources and methods in World Bank's "The Changing Wealth of Nations: Measuring Sustainable Development in the New Millennium" (2011).
Categories, topics:
Economy & Growth
Last updated:
apr 23, 2017
Indicators value changes by year
Minimum:
5.837 bln
jan 1, 2009
Maximum:
15.198 bln
jan 1, 1999
At the date of observation
Value
Absolute change
Change from previous value
jan 1, 1977
7.455 bln
+7.455 bln
0.0%
jan 1, 1978
6.956 bln
-499.192 mln
-6.7%
jan 1, 1979
6.787 bln
-169.221 mln
-2.43%
jan 1, 1980
7.051 bln
+264.297 mln
3.89%
jan 1, 1981
7.318 bln
+267.242 mln
3.79%
jan 1, 1982
8.083 bln
+764.719 mln
10.45%
jan 1, 1983
8.327 bln
+244.238 mln
3.02%
jan 1, 1984
8.654 bln
+327.297 mln
3.93%
jan 1, 1985
8.784 bln
+129.204 mln
1.49%
jan 1, 1986
9.403 bln
+619.386 mln
7.05%
jan 1, 1987
9.535 bln
+132.211 mln
1.41%
jan 1, 1988
9.62 bln
+84.975 mln
0.89%
jan 1, 1989
10.55 bln
+929.523 mln
9.66%
jan 1, 1990
11.261 bln
+711.008 mln
6.74%
jan 1, 1991
11.992 bln
+731.073 mln
6.49%
jan 1, 1992
12.782 bln
+789.819 mln
6.59%
jan 1, 1993
11.251 bln
-1.53 bln
-11.97%
jan 1, 1994
11.145 bln
-106.315 mln
-0.94%
jan 1, 1995
12.206 bln
+1.061 bln
9.52%
jan 1, 1996
12.458 bln
+251.928 mln
2.06%
jan 1, 1997
14.449 bln
+1.991 bln
15.98%
jan 1, 1998
14.623 bln
+174.297 mln
1.21%
jan 1, 1999
15.198 bln
+574.312 mln
3.93%
jan 1, 2000
14.819 bln
-378.982 mln
-2.49%
jan 1, 2001
14.318 bln
-500.463 mln
-3.38%
jan 1, 2002
14.348 bln
+30.204 mln
0.21%
jan 1, 2003
13.173 bln
-1.175 bln
-8.19%
jan 1, 2004
10.712 bln
-2.461 bln
-18.68%
jan 1, 2005
9.503 bln
-1.21 bln
-11.29%
jan 1, 2006
8.797 bln
-705.068 mln
-7.42%
jan 1, 2007
8.136 bln
-661.904 mln
-7.52%
jan 1, 2008
7.64 bln
-495.319 mln
-6.09%
jan 1, 2009
5.837 bln
-1.803 bln
-23.6%
jan 1, 2010
8.037 bln
+2.2 bln
37.69%
jan 1, 2011
8.466 bln
+429.438 mln
5.34%
jan 1, 2012
8.581 bln
+114.897 mln
1.36%
jan 1, 2013
10.169 bln
+1.588 bln
18.5%
jan 1, 2014
10.961 bln
+791.539 mln
7.78%
jan 1, 2015
11.41 bln
+449.886 mln
4.1%
Ranking of countries by current statistics by years


Comments: