29
/
en
AIzaSyAYiBZKx7MnpbEhh9jyipgxe19OcubqV5w
April 1, 2024
32349
Europe & Central Asia (IDA & IBRD countries)
TEC
false
2
1
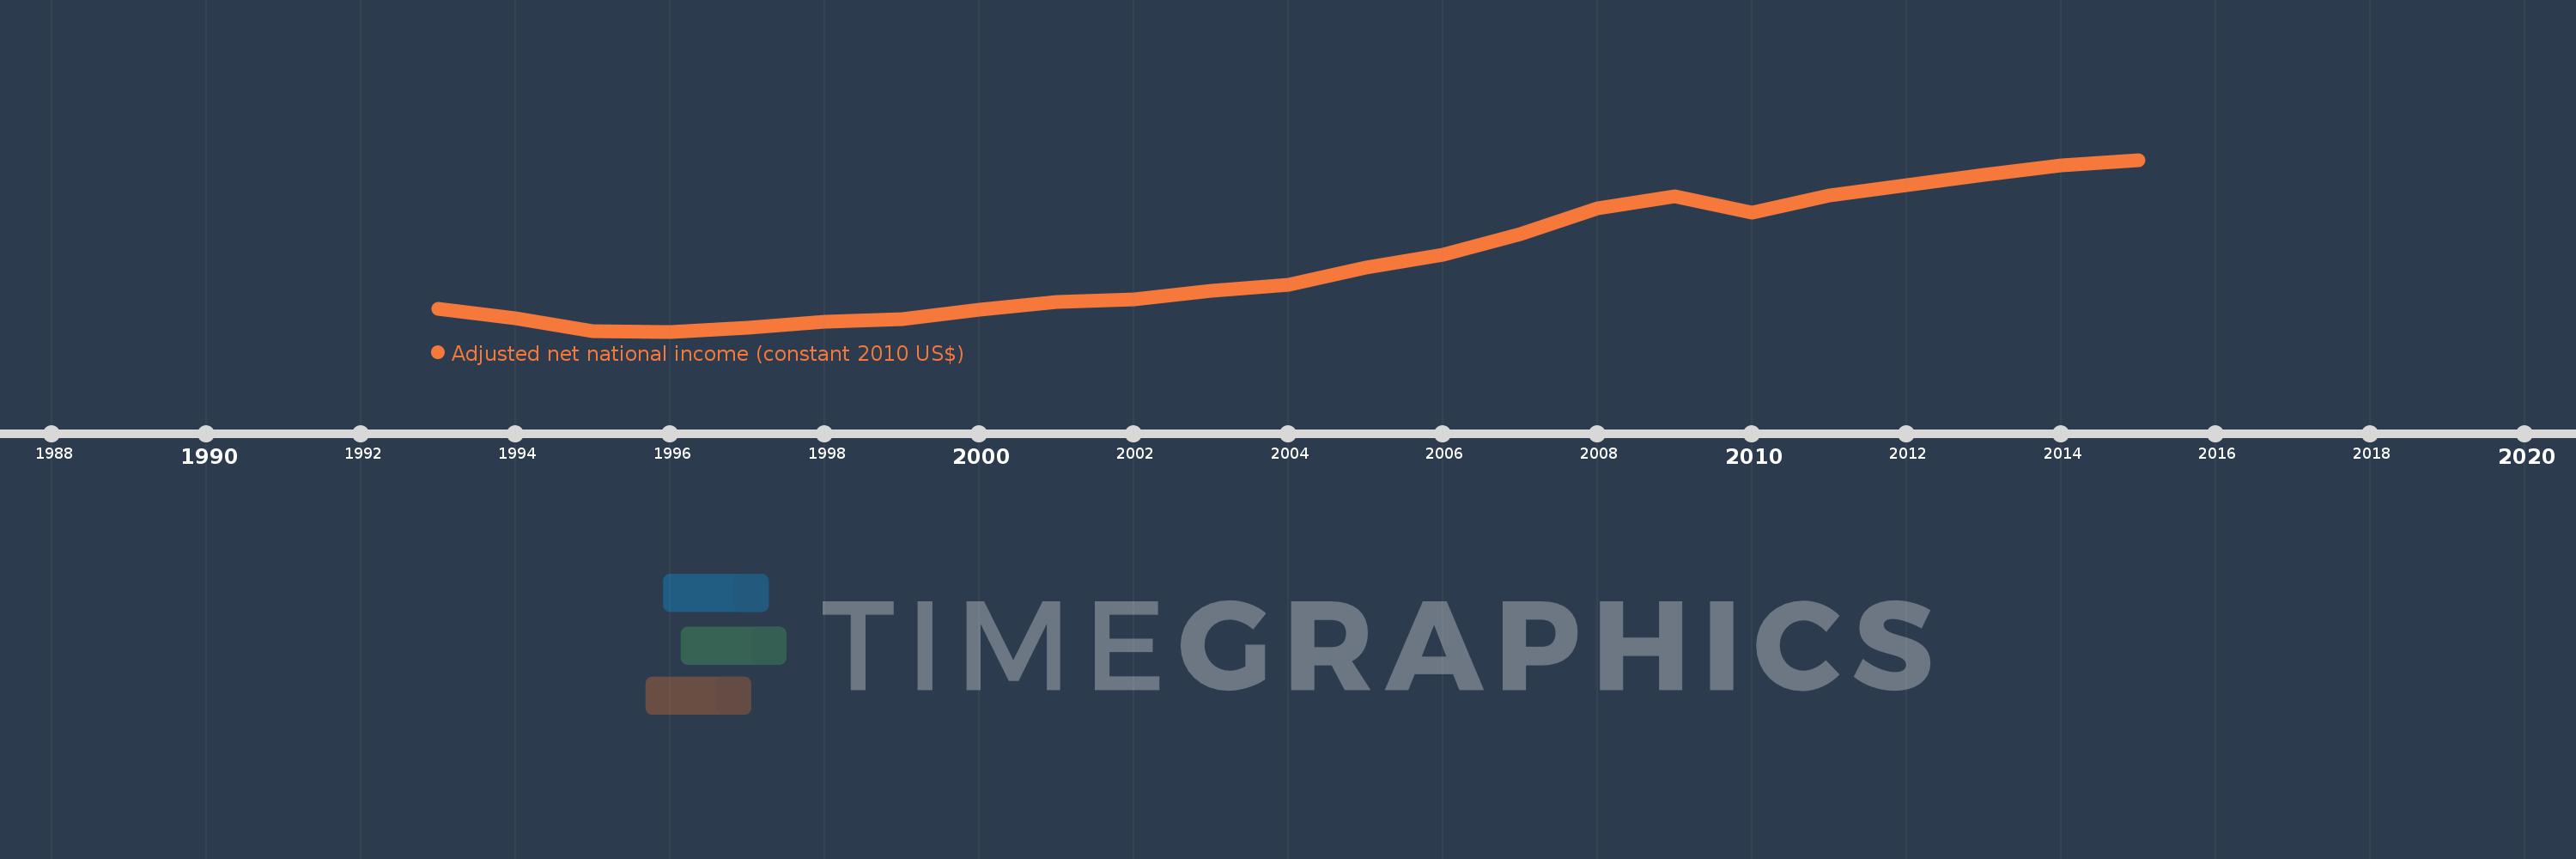
Adjusted net national income (constant 2010 US$)
2015,2014,2013,2012,2011,2010,2009,2008,2007,2006,2005,2004,2003,2002,2001,2000,1999,1998,1997,1996,1995,1994,1993
This statistics in other country:
AfghanistanAlbaniaAlgeriaAngolaArab WorldArgentinaArmeniaAustraliaAustriaAzerbaijanBahamas, TheBahrainBangladeshBarbadosBelarusBelgiumBelizeBeninBhutanBoliviaBotswanaBrazilBulgariaBurkina FasoBurundiCabo VerdeCambodiaCameroonCanadaCaribbean small statesCentral African RepublicCentral Europe and the BalticsChadChileChinaColombiaComorosCongo, Dem. Rep.Congo, Rep.Costa RicaCote d'IvoireCroatiaCubaCyprusCzech RepublicDenmarkDominicaDominican RepublicEarly-demographic dividendEast Asia & PacificEast Asia & Pacific (excluding high income)East Asia & Pacific (IDA & IBRD countries)EcuadorEgypt, Arab Rep.El SalvadorEritreaEstoniaEthiopiaEuro areaEurope & Central AsiaEurope & Central Asia (excluding high income)Europe & Central Asia (IDA & IBRD countries)European UnionFijiFinlandFragile and conflict affected situationsFranceGabonGambia, TheGeorgiaGermanyGhanaGreeceGuatemalaGuineaGuinea-BissauGuyanaHaitiHeavily indebted poor countries (HIPC)High incomeHondurasHungaryIBRD onlyIDA & IBRD totalIDA blendIDA onlyIDA totalIndiaIndonesiaIran, Islamic Rep.IraqIrelandIsraelItalyJamaicaJapanJordanKazakhstanKenyaKiribatiKorea, Rep.KuwaitKyrgyz RepublicLao PDRLate-demographic dividendLatin America & Caribbean Latin America & Caribbean (excluding high income)Latin America & the Caribbean (IDA & IBRD countries)LatviaLeast developed countries: UN classificationLebanonLesothoLiberiaLibyaLithuaniaLow & middle incomeLow incomeLower middle incomeLuxembourgMacedonia, FYRMadagascarMalawiMalaysiaMaldivesMaliMauritaniaMauritiusMexicoMiddle East & North AfricaMiddle East & North Africa (excluding high income)Middle East & North Africa (IDA & IBRD countries)Middle incomeMoldovaMongoliaMoroccoMozambiqueNamibiaNepalNetherlandsNew ZealandNicaraguaNigerNigeriaNorth AmericaNorwayOECD membersOmanOther small statesPacific island small statesPakistanPanamaPapua New GuineaParaguayPeruPhilippinesPolandPortugalPost-demographic dividendPre-demographic dividendQatarRomaniaRussian FederationRwandaSamoaSao Tome and PrincipeSaudi ArabiaSenegalSeychellesSierra LeoneSingaporeSlovak RepublicSloveniaSmall statesSolomon IslandsSouth AfricaSouth AsiaSouth Asia (IDA & IBRD)SpainSri LankaSt. LuciaSt. Vincent and the GrenadinesSub-Saharan Africa Sub-Saharan Africa (excluding high income)Sub-Saharan Africa (IDA & IBRD countries)SurinameSwazilandSwedenSwitzerlandTajikistanTanzaniaThailandTogoTongaTrinidad and TobagoTunisiaTurkeyTurkmenistanUgandaUkraineUnited Arab EmiratesUnited KingdomUnited StatesUpper middle incomeUruguayUzbekistanVanuatuVenezuela, RBVietnamWorldYemen, Rep.ZambiaZimbabwe Timeline:
This timeline shows a graph from 1993 to 2015 of Europe & Central Asia (IDA & IBRD countries). No data until 1992. Number of actual observations by date: 23.
Source name:
World Development Indicators
Source organization:
World Bank staff estimates based on sources and methods in World Bank's "The Changing Wealth of Nations: Measuring Sustainable Development in the New Millennium" (2011).
Categories, topics:
Economy & Growth
Last updated:
apr 23, 2017
Indicators value changes by year
Minimum:
1.462 trl
jan 1, 1996
Maximum:
3.336 trl
jan 1, 2015
At the date of observation
Value
Absolute change
Change from previous value
jan 1, 1993
1.711 trl
+1.711 trl
0.0%
jan 1, 1994
1.602 trl
-108.24 bln
-6.33%
jan 1, 1995
1.471 trl
-131.672 bln
-8.22%
jan 1, 1996
1.462 trl
-9.211 bln
-0.63%
jan 1, 1997
1.499 trl
+37.853 bln
2.59%
jan 1, 1998
1.574 trl
+74.327 bln
4.96%
jan 1, 1999
1.6 trl
+26.716 bln
1.7%
jan 1, 2000
1.704 trl
+103.105 bln
6.44%
jan 1, 2001
1.786 trl
+82.274 bln
4.83%
jan 1, 2002
1.812 trl
+26.548 bln
1.49%
jan 1, 2003
1.903 trl
+90.572 bln
5.0%
jan 1, 2004
1.976 trl
+73.495 bln
3.86%
jan 1, 2005
2.157 trl
+180.414 bln
9.13%
jan 1, 2006
2.301 trl
+143.913 bln
6.67%
jan 1, 2007
2.527 trl
+225.85 bln
9.82%
jan 1, 2008
2.804 trl
+277.288 bln
10.97%
jan 1, 2009
2.94 trl
+135.981 bln
4.85%
jan 1, 2010
2.757 trl
-183.04 bln
-6.23%
jan 1, 2011
2.945 trl
+187.946 bln
6.82%
jan 1, 2012
3.063 trl
+117.902 bln
4.0%
jan 1, 2013
3.168 trl
+105.123 bln
3.43%
jan 1, 2014
3.277 trl
+109.387 bln
3.45%
jan 1, 2015
3.336 trl
+58.454 bln
1.78%
Ranking of countries by current statistics by years


Comments: