29
/
en
AIzaSyAYiBZKx7MnpbEhh9jyipgxe19OcubqV5w
April 1, 2024
115533
Cuba
CUB
true
2
1
Adjusted net national income (constant 2010 US$)
2012,2011,2010,2009,2008,2007,2006,2005,2004,2003,2002,2001,2000,1999,1998,1997,1996,1995,1994,1993,1992,1991,1990,1989,1988,1987,1986,1985,1984,1983,1982,1981,1980,1979,1978,1977,1976,1975,1974,1973,1972,1971
This statistics in other country:
AfghanistanAlbaniaAlgeriaAngolaArab WorldArgentinaArmeniaAustraliaAustriaAzerbaijanBahamas, TheBahrainBangladeshBarbadosBelarusBelgiumBelizeBeninBhutanBoliviaBotswanaBrazilBulgariaBurkina FasoBurundiCabo VerdeCambodiaCameroonCanadaCaribbean small statesCentral African RepublicCentral Europe and the BalticsChadChileChinaColombiaComorosCongo, Dem. Rep.Congo, Rep.Costa RicaCote d'IvoireCroatiaCubaCyprusCzech RepublicDenmarkDominicaDominican RepublicEarly-demographic dividendEast Asia & PacificEast Asia & Pacific (excluding high income)East Asia & Pacific (IDA & IBRD countries)EcuadorEgypt, Arab Rep.El SalvadorEritreaEstoniaEthiopiaEuro areaEurope & Central AsiaEurope & Central Asia (excluding high income)Europe & Central Asia (IDA & IBRD countries)European UnionFijiFinlandFragile and conflict affected situationsFranceGabonGambia, TheGeorgiaGermanyGhanaGreeceGuatemalaGuineaGuinea-BissauGuyanaHaitiHeavily indebted poor countries (HIPC)High incomeHondurasHungaryIBRD onlyIDA & IBRD totalIDA blendIDA onlyIDA totalIndiaIndonesiaIran, Islamic Rep.IraqIrelandIsraelItalyJamaicaJapanJordanKazakhstanKenyaKiribatiKorea, Rep.KuwaitKyrgyz RepublicLao PDRLate-demographic dividendLatin America & Caribbean Latin America & Caribbean (excluding high income)Latin America & the Caribbean (IDA & IBRD countries)LatviaLeast developed countries: UN classificationLebanonLesothoLiberiaLibyaLithuaniaLow & middle incomeLow incomeLower middle incomeLuxembourgMacedonia, FYRMadagascarMalawiMalaysiaMaldivesMaliMauritaniaMauritiusMexicoMiddle East & North AfricaMiddle East & North Africa (excluding high income)Middle East & North Africa (IDA & IBRD countries)Middle incomeMoldovaMongoliaMoroccoMozambiqueNamibiaNepalNetherlandsNew ZealandNicaraguaNigerNigeriaNorth AmericaNorwayOECD membersOmanOther small statesPacific island small statesPakistanPanamaPapua New GuineaParaguayPeruPhilippinesPolandPortugalPost-demographic dividendPre-demographic dividendQatarRomaniaRussian FederationRwandaSamoaSao Tome and PrincipeSaudi ArabiaSenegalSeychellesSierra LeoneSingaporeSlovak RepublicSloveniaSmall statesSolomon IslandsSouth AfricaSouth AsiaSouth Asia (IDA & IBRD)SpainSri LankaSt. LuciaSt. Vincent and the GrenadinesSub-Saharan Africa Sub-Saharan Africa (excluding high income)Sub-Saharan Africa (IDA & IBRD countries)SurinameSwazilandSwedenSwitzerlandTajikistanTanzaniaThailandTogoTongaTrinidad and TobagoTunisiaTurkeyTurkmenistanUgandaUkraineUnited Arab EmiratesUnited KingdomUnited StatesUpper middle incomeUruguayUzbekistanVanuatuVenezuela, RBVietnamWorldYemen, Rep.ZambiaZimbabwe Timeline:
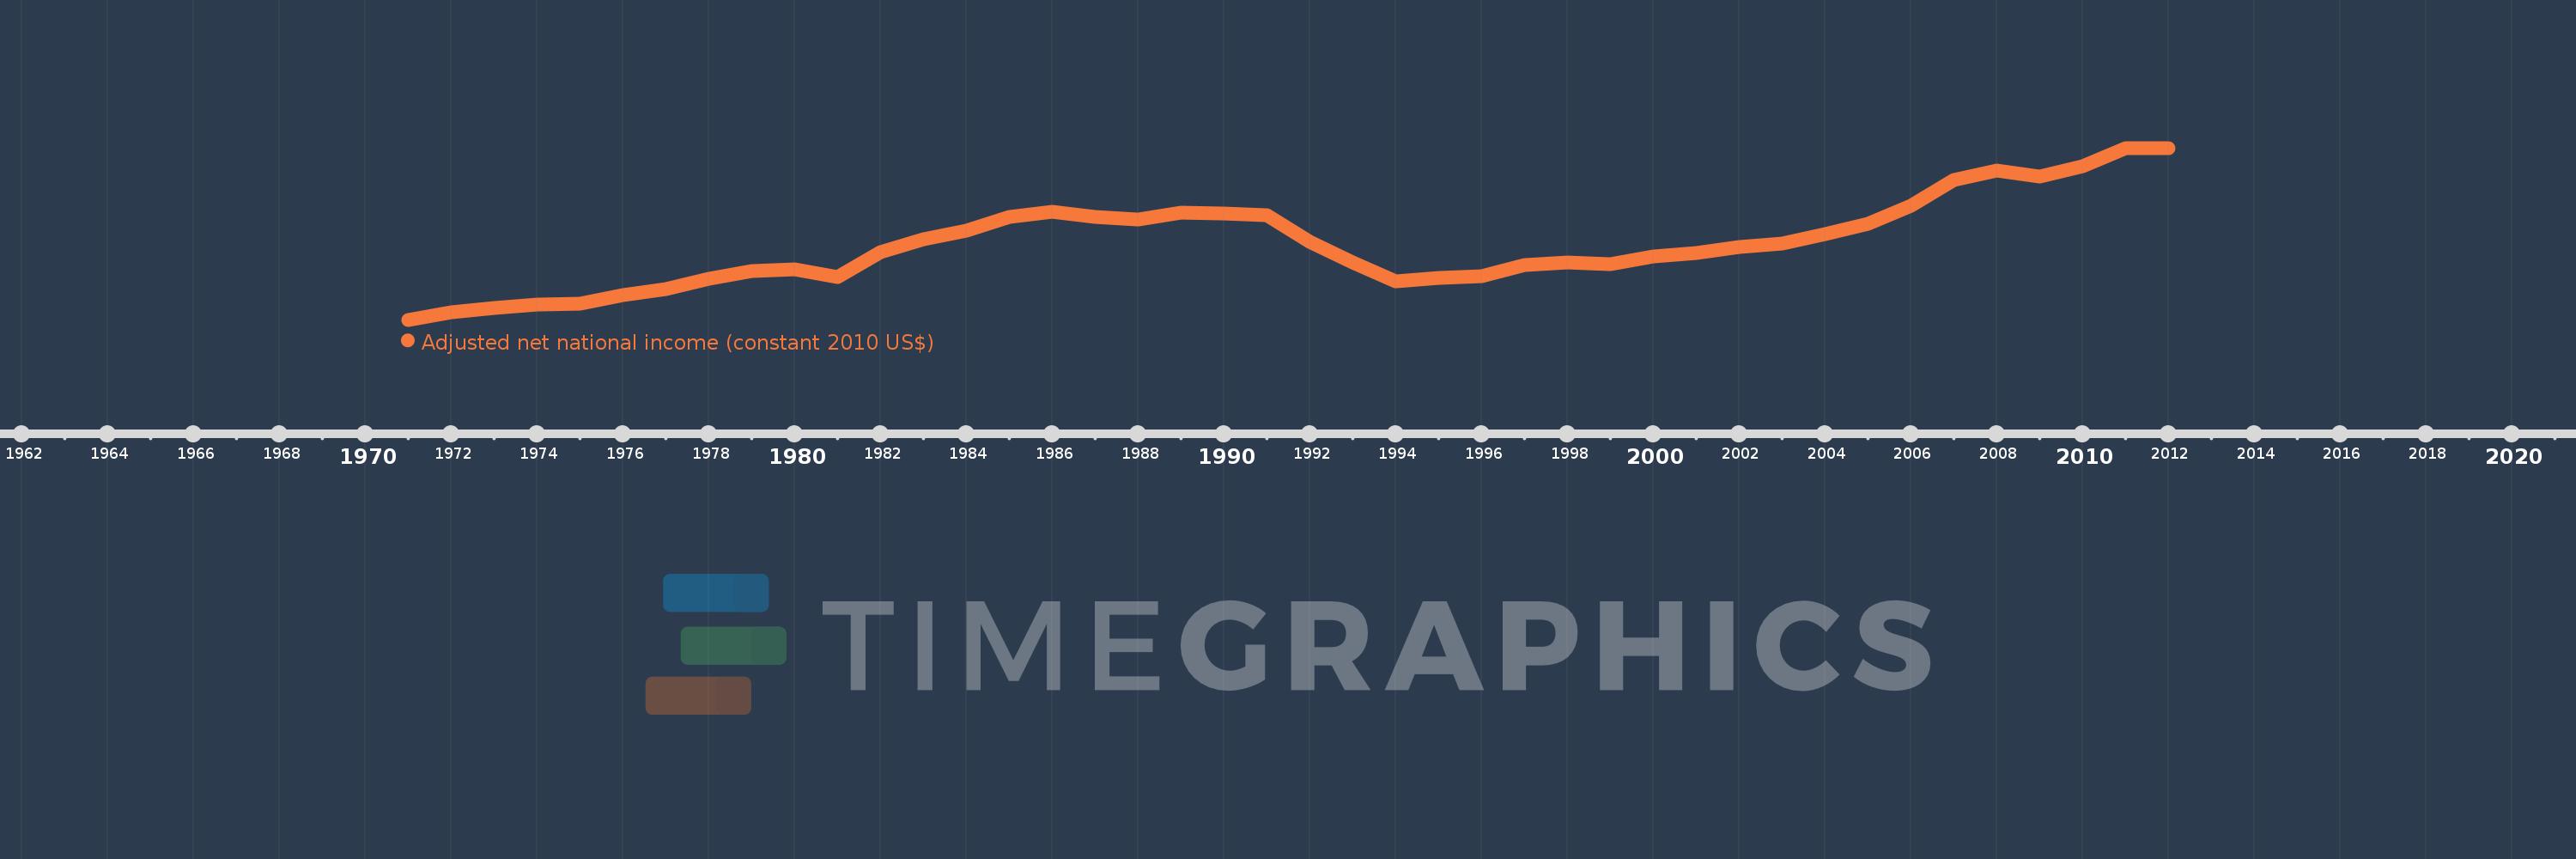
This timeline shows a graph from 1971 to 2012 of Cuba. No data until 1970. Number of actual observations by date: 42.
Source name:
World Development Indicators
Source organization:
World Bank staff estimates based on sources and methods in World Bank's "The Changing Wealth of Nations: Measuring Sustainable Development in the New Millennium" (2011).
Categories, topics:
Economy & Growth
Last updated:
apr 23, 2017
Indicators value changes by year
Minimum:
18.43 bln
jan 1, 1971
Maximum:
55.83 bln
jan 1, 2012
At the date of observation
Value
Absolute change
Change from previous value
jan 1, 1971
18.43 bln
+18.43 bln
0.0%
jan 1, 1972
20.01 bln
+1.579 bln
8.57%
jan 1, 1973
20.977 bln
+967.488 mln
4.84%
jan 1, 1974
21.697 bln
+719.597 mln
3.43%
jan 1, 1975
21.911 bln
+213.911 mln
0.99%
jan 1, 1976
23.864 bln
+1.953 bln
8.91%
jan 1, 1977
25.137 bln
+1.273 bln
5.34%
jan 1, 1978
27.303 bln
+2.166 bln
8.62%
jan 1, 1979
29.123 bln
+1.82 bln
6.66%
jan 1, 1980
29.356 bln
+233.509 mln
0.8%
jan 1, 1981
27.769 bln
-1.588 bln
-5.41%
jan 1, 1982
33.102 bln
+5.333 bln
19.2%
jan 1, 1983
35.89 bln
+2.788 bln
8.42%
jan 1, 1984
37.878 bln
+1.988 bln
5.54%
jan 1, 1985
40.823 bln
+2.945 bln
7.77%
jan 1, 1986
41.919 bln
+1.097 bln
2.69%
jan 1, 1987
40.807 bln
-1.112 bln
-2.65%
jan 1, 1988
40.234 bln
-572.664 mln
-1.4%
jan 1, 1989
41.687 bln
+1.453 bln
3.61%
jan 1, 1990
41.597 bln
-90.497 mln
-0.22%
jan 1, 1991
41.137 bln
-460.306 mln
-1.11%
jan 1, 1992
35.35 bln
-5.786 bln
-14.07%
jan 1, 1993
30.866 bln
-4.484 bln
-12.69%
jan 1, 1994
26.782 bln
-4.084 bln
-13.23%
jan 1, 1995
27.597 bln
+815.061 mln
3.04%
jan 1, 1996
27.847 bln
+250.152 mln
0.91%
jan 1, 1997
30.291 bln
+2.444 bln
8.78%
jan 1, 1998
30.927 bln
+636.007 mln
2.1%
jan 1, 1999
30.585 bln
-342.064 mln
-1.11%
jan 1, 2000
32.293 bln
+1.708 bln
5.58%
jan 1, 2001
32.94 bln
+646.936 mln
2.0%
jan 1, 2002
34.314 bln
+1.374 bln
4.17%
jan 1, 2003
34.99 bln
+676.589 mln
1.97%
jan 1, 2004
37.054 bln
+2.064 bln
5.9%
jan 1, 2005
39.281 bln
+2.227 bln
6.01%
jan 1, 2006
43.311 bln
+4.03 bln
10.26%
jan 1, 2007
48.921 bln
+5.61 bln
12.95%
jan 1, 2008
50.878 bln
+1.957 bln
4.0%
jan 1, 2009
49.652 bln
-1.226 bln
-2.41%
jan 1, 2010
51.924 bln
+2.273 bln
4.58%
jan 1, 2011
55.793 bln
+3.868 bln
7.45%
jan 1, 2012
55.83 bln
+37.635 mln
0.07%
Ranking of countries by current statistics by years


Comments: