30
/
AIzaSyAYiBZKx7MnpbEhh9jyipgxe19OcubqV5w
April 1, 2024
75400
Azerbaijan
AZE
true
2
1
Net ODA received (% of gross capital formation)
2015,2014,2013,2012,2011,2010,2009,2008,2007,2006,2005,2004,2003,2002,2001,2000,1999,1998,1997,1996,1995,1994,1993,1992
Download
Global statistics library →Azerbaijan →

Net ODA received (% of gross capital formation)

This statistics in other country:

AfghanistanAlbaniaAlgeriaAngolaAntigua and BarbudaArab WorldArgentinaArmeniaArubaAzerbaijanBahamas, TheBahrainBangladeshBarbadosBelarusBelizeBeninBhutanBoliviaBosnia and HerzegovinaBotswanaBrazilBrunei DarussalamBurkina FasoBurundiCabo VerdeCambodiaCameroonCaribbean small statesCentral African RepublicCentral Europe and the BalticsChadChileChinaColombiaComorosCongo, Dem. Rep.Congo, Rep.Costa RicaCote d'IvoireCroatiaCubaCyprusDjiboutiDominicaDominican RepublicEast Asia & PacificEast Asia & Pacific (excluding high income)East Asia & Pacific (IDA & IBRD countries)EcuadorEgypt, Arab Rep.El SalvadorEquatorial GuineaEritreaEthiopiaEuro areaEurope & Central AsiaEurope & Central Asia (excluding high income)Europe & Central Asia (IDA & IBRD countries)European UnionFijiFragile and conflict affected situationsGabonGambia, TheGeorgiaGhanaGrenadaGuatemalaGuineaGuinea-BissauGuyanaHaitiHeavily indebted poor countries (HIPC)High incomeHondurasHong Kong SAR, ChinaIBRD onlyIDA & IBRD totalIDA blendIDA onlyIDA totalIndiaIndonesiaIran, Islamic Rep.IraqIsraelJamaicaJordanKazakhstanKenyaKiribatiKorea, Rep.KosovoKuwaitKyrgyz RepublicLao PDRLatin America & Caribbean Latin America & Caribbean (excluding high income)Latin America & the Caribbean (IDA & IBRD countries)Least developed countries: UN classificationLebanonLesothoLiberiaLibyaLow & middle incomeLow incomeLower middle incomeMacao SAR, ChinaMacedonia, FYRMadagascarMalawiMalaysiaMaldivesMaliMaltaMauritaniaMauritiusMexicoMiddle East & North AfricaMiddle East & North Africa (excluding high income)Middle East & North Africa (IDA & IBRD countries)Middle incomeMoldovaMongoliaMontenegroMoroccoMozambiqueNamibiaNepalNew CaledoniaNicaraguaNigerNigeriaNorth AmericaOECD membersOmanOther small statesPakistanPanamaPapua New GuineaParaguayPeruPhilippinesQatarRwandaSaudi ArabiaSenegalSerbiaSeychellesSierra LeoneSingaporeSloveniaSmall statesSolomon IslandsSouth AfricaSouth AsiaSouth Asia (IDA & IBRD)South SudanSri LankaSt. Kitts and NevisSt. LuciaSt. Vincent and the GrenadinesSub-Saharan Africa Sub-Saharan Africa (excluding high income)Sub-Saharan Africa (IDA & IBRD countries)SudanSurinameSwazilandSyrian Arab RepublicTajikistanTanzaniaThailandTimor-LesteTogoTongaTrinidad and TobagoTunisiaTurkeyTurkmenistanUgandaUkraineUpper middle incomeUruguayUzbekistanVanuatuVenezuela, RBVietnamWest Bank and GazaWorldYemen, Rep.ZambiaZimbabwe

Timeline:

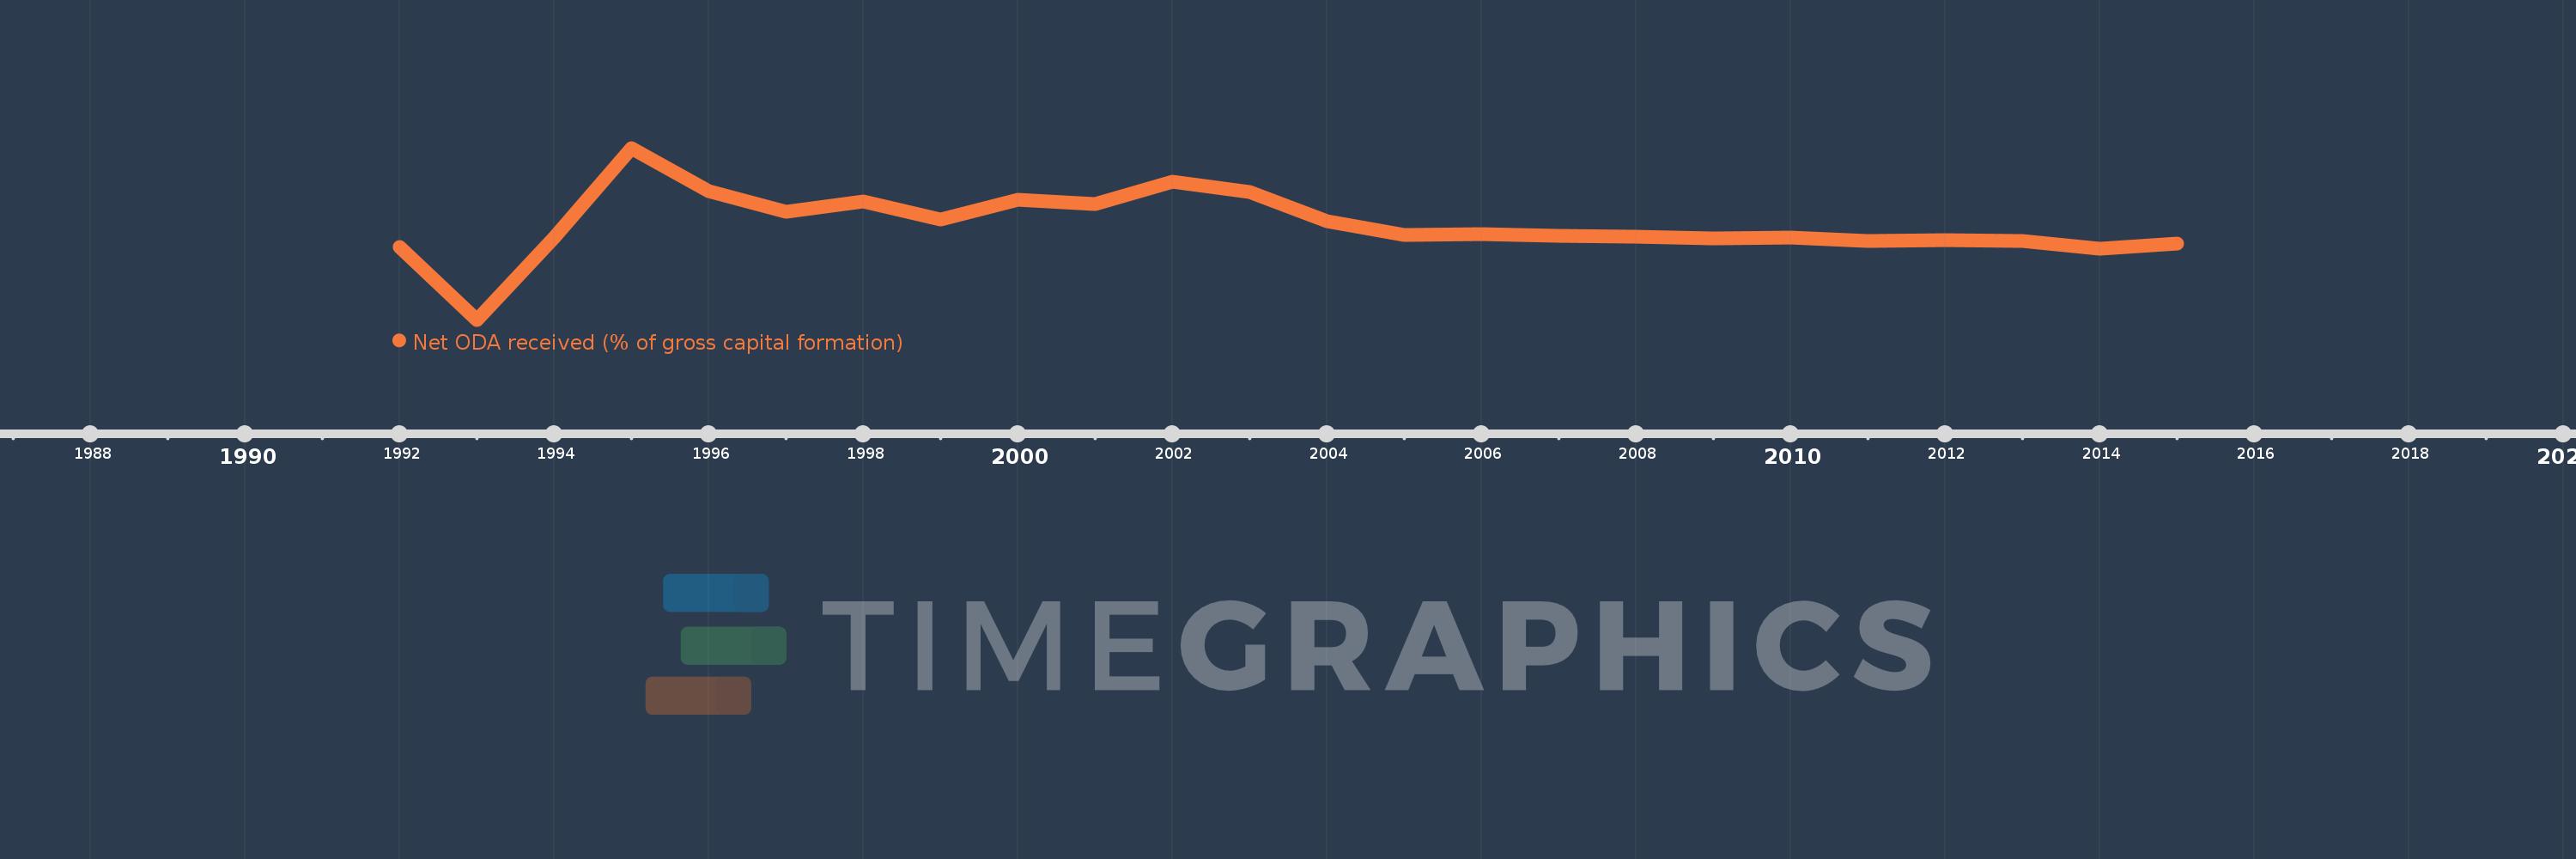
This timeline shows a graph from 1992 to 2015 of Azerbaijan. No data until 1991. Number of actual observations by date: 24.

Source name:

World Development Indicators

Source organization:

Development Assistance Committee of the Organisation for Economic Co-operation and Development, Geographical Distribution of Financial Flows to Developing Countries, Development Co-operation Report, and International Development Statistics database. Data are available online at: www.oecd.org/dac/stats/idsonline. World Bank gross capital formation estimates are used for the denominator.

Categories, topics:

Aid Effectiveness

Last updated:

apr 23, 2017

Indicators value changes by year

Meaning:
6.462
Minimum:
-21.547
jan 1, 1993
Maximum:
29.369
jan 1, 1995
At the date of observation
Value
Absolute change
Change from the previous value
jan 1, 1992
0.111
+0.111
0.0%
jan 1, 1993
-21.547
-21.657
-19.6K%
jan 1, 1994
2.758
+24.305
-112.8%
jan 1, 1995
29.369
+26.612
964.99%
jan 1, 1996
16.469
-12.901
-43.93%
jan 1, 1997
10.46
-6.009
-36.49%
jan 1, 1998
13.567
+3.107
29.7%
jan 1, 1999
8.105
-5.462
-40.26%
jan 1, 2000
13.957
+5.852
72.21%
jan 1, 2001
12.763
-1.195
-8.56%
jan 1, 2002
19.47
+6.707
52.56%
jan 1, 2003
16.2
-3.27
-16.79%
jan 1, 2004
7.773
-8.427
-52.02%
jan 1, 2005
3.492
-4.282
-55.08%
jan 1, 2006
3.935
+0.444
12.71%
jan 1, 2007
3.294
-0.641
-16.3%
jan 1, 2008
3.166
-0.128
-3.9%
jan 1, 2009
2.575
-0.591
-18.66%
jan 1, 2010
2.762
+0.187
7.26%
jan 1, 2011
1.676
-1.086
-39.31%
jan 1, 2012
2.144
+0.468
27.91%
jan 1, 2013
1.886
-0.258
-12.03%
jan 1, 2014
-0.404
-2.29
-121.4%
jan 1, 2015
1.111
+1.515
-375.18%

Ranking of countries by current statistics by years