29
/
en
AIzaSyAYiBZKx7MnpbEhh9jyipgxe19OcubqV5w
April 1, 2024
62873
World
WLD
false
2
1
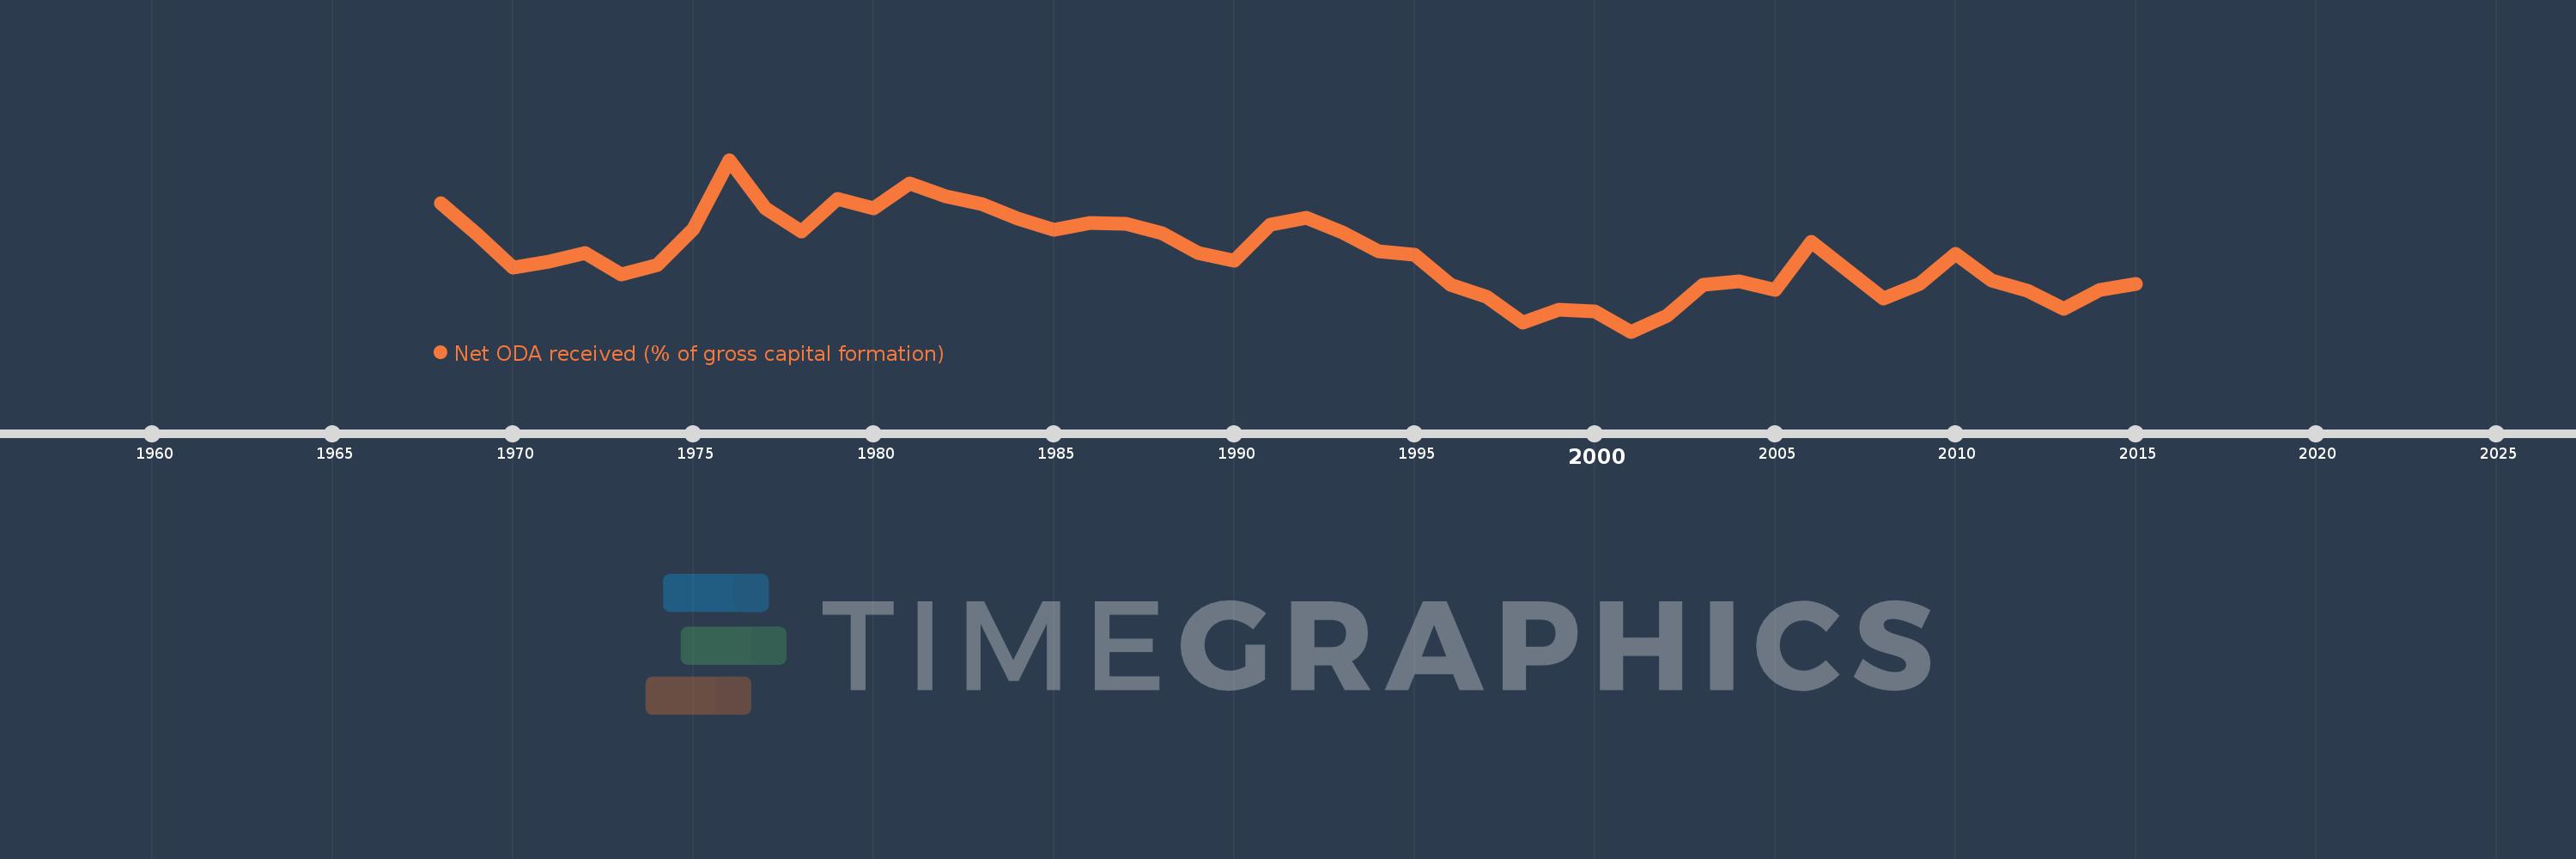
Net ODA received (% of gross capital formation)
2015,2014,2013,2012,2011,2010,2009,2008,2007,2006,2005,2004,2003,2002,2001,2000,1999,1998,1997,1996,1995,1994,1993,1992,1991,1990,1989,1988,1987,1986,1985,1984,1983,1982,1981,1980,1979,1978,1977,1976,1975,1974,1973,1972,1971,1970,1969,1968
This statistics in other country:
AfghanistanAlbaniaAlgeriaAngolaAntigua and BarbudaArab WorldArgentinaArmeniaArubaAzerbaijanBahamas, TheBahrainBangladeshBarbadosBelarusBelizeBeninBhutanBoliviaBosnia and HerzegovinaBotswanaBrazilBrunei DarussalamBurkina FasoBurundiCabo VerdeCambodiaCameroonCaribbean small statesCentral African RepublicCentral Europe and the BalticsChadChileChinaColombiaComorosCongo, Dem. Rep.Congo, Rep.Costa RicaCote d'IvoireCroatiaCubaCyprusDjiboutiDominicaDominican RepublicEast Asia & PacificEast Asia & Pacific (excluding high income)East Asia & Pacific (IDA & IBRD countries)EcuadorEgypt, Arab Rep.El SalvadorEquatorial GuineaEritreaEthiopiaEuro areaEurope & Central AsiaEurope & Central Asia (excluding high income)Europe & Central Asia (IDA & IBRD countries)European UnionFijiFragile and conflict affected situationsGabonGambia, TheGeorgiaGhanaGrenadaGuatemalaGuineaGuinea-BissauGuyanaHaitiHeavily indebted poor countries (HIPC)High incomeHondurasHong Kong SAR, ChinaIBRD onlyIDA & IBRD totalIDA blendIDA onlyIDA totalIndiaIndonesiaIran, Islamic Rep.IraqIsraelJamaicaJordanKazakhstanKenyaKiribatiKorea, Rep.KosovoKuwaitKyrgyz RepublicLao PDRLatin America & Caribbean Latin America & Caribbean (excluding high income)Latin America & the Caribbean (IDA & IBRD countries)Least developed countries: UN classificationLebanonLesothoLiberiaLibyaLow & middle incomeLow incomeLower middle incomeMacao SAR, ChinaMacedonia, FYRMadagascarMalawiMalaysiaMaldivesMaliMaltaMauritaniaMauritiusMexicoMiddle East & North AfricaMiddle East & North Africa (excluding high income)Middle East & North Africa (IDA & IBRD countries)Middle incomeMoldovaMongoliaMontenegroMoroccoMozambiqueNamibiaNepalNew CaledoniaNicaraguaNigerNigeriaNorth AmericaOECD membersOmanOther small statesPakistanPanamaPapua New GuineaParaguayPeruPhilippinesQatarRwandaSaudi ArabiaSenegalSerbiaSeychellesSierra LeoneSingaporeSloveniaSmall statesSolomon IslandsSouth AfricaSouth AsiaSouth Asia (IDA & IBRD)South SudanSri LankaSt. Kitts and NevisSt. LuciaSt. Vincent and the GrenadinesSub-Saharan Africa Sub-Saharan Africa (excluding high income)Sub-Saharan Africa (IDA & IBRD countries)SudanSurinameSwazilandSyrian Arab RepublicTajikistanTanzaniaThailandTimor-LesteTogoTongaTrinidad and TobagoTunisiaTurkeyTurkmenistanUgandaUkraineUpper middle incomeUruguayUzbekistanVanuatuVenezuela, RBVietnamWest Bank and GazaWorldYemen, Rep.ZambiaZimbabwe Timeline:
This timeline shows a graph from 1968 to 2015 of World. No data until 1967. Number of actual observations by date: 48.
Source name:
World Development Indicators
Source organization:
Development Assistance Committee of the Organisation for Economic Co-operation and Development, Geographical Distribution of Financial Flows to Developing Countries, Development Co-operation Report, and International Development Statistics database. Data are available online at: www.oecd.org/dac/stats/idsonline. World Bank gross capital formation estimates are used for the denominator.
Categories, topics:
Aid Effectiveness
Last updated:
apr 23, 2017
Indicators value changes by year
At the date of observation
Value
Absolute change
Change from previous value
jan 1, 1968
1.117
+1.117
0.0%
jan 1, 1969
1.001
-0.115
-10.31%
jan 1, 1970
0.871
-0.13
-13.01%
jan 1, 1971
0.896
+0.025
2.84%
jan 1, 1972
0.927
+0.031
3.48%
jan 1, 1973
0.847
-0.08
-8.68%
jan 1, 1974
0.883
+0.037
4.35%
jan 1, 1975
1.02
+0.136
15.43%
jan 1, 1976
1.284
+0.265
25.94%
jan 1, 1977
1.099
-0.185
-14.4%
jan 1, 1978
1.009
-0.091
-8.26%
jan 1, 1979
1.136
+0.128
12.67%
jan 1, 1980
1.097
-0.04
-3.48%
jan 1, 1981
1.195
+0.098
8.92%
jan 1, 1982
1.146
-0.048
-4.04%
jan 1, 1983
1.116
-0.03
-2.61%
jan 1, 1984
1.059
-0.057
-5.14%
jan 1, 1985
1.016
-0.043
-4.1%
jan 1, 1986
1.042
+0.027
2.63%
jan 1, 1987
1.039
-0.003
-0.29%
jan 1, 1988
1.002
-0.037
-3.55%
jan 1, 1989
0.928
-0.075
-7.44%
jan 1, 1990
0.899
-0.029
-3.13%
jan 1, 1991
1.037
+0.138
15.36%
jan 1, 1992
1.062
+0.025
2.45%
jan 1, 1993
1.006
-0.056
-5.3%
jan 1, 1994
0.933
-0.073
-7.27%
jan 1, 1995
0.92
-0.013
-1.38%
jan 1, 1996
0.806
-0.113
-12.33%
jan 1, 1997
0.759
-0.047
-5.89%
jan 1, 1998
0.661
-0.098
-12.95%
jan 1, 1999
0.711
+0.05
7.62%
jan 1, 2000
0.704
-0.007
-1.0%
jan 1, 2001
0.627
-0.076
-10.86%
jan 1, 2002
0.688
+0.06
9.6%
jan 1, 2003
0.805
+0.118
17.1%
jan 1, 2004
0.818
+0.013
1.57%
jan 1, 2005
0.786
-0.032
-3.88%
jan 1, 2006
0.971
+0.185
23.48%
jan 1, 2007
0.861
-0.109
-11.28%
jan 1, 2008
0.753
-0.108
-12.56%
jan 1, 2009
0.809
+0.056
7.42%
jan 1, 2010
0.923
+0.114
14.14%
jan 1, 2011
0.824
-0.1
-10.78%
jan 1, 2012
0.783
-0.04
-4.91%
jan 1, 2013
0.713
-0.07
-8.92%
jan 1, 2014
0.785
+0.072
10.03%
jan 1, 2015
0.809
+0.024
3.09%
Ranking of countries by current statistics by years


Comments: