29
/
en
AIzaSyAYiBZKx7MnpbEhh9jyipgxe19OcubqV5w
April 1, 2024
190623
Mali
MLI
true
2
1
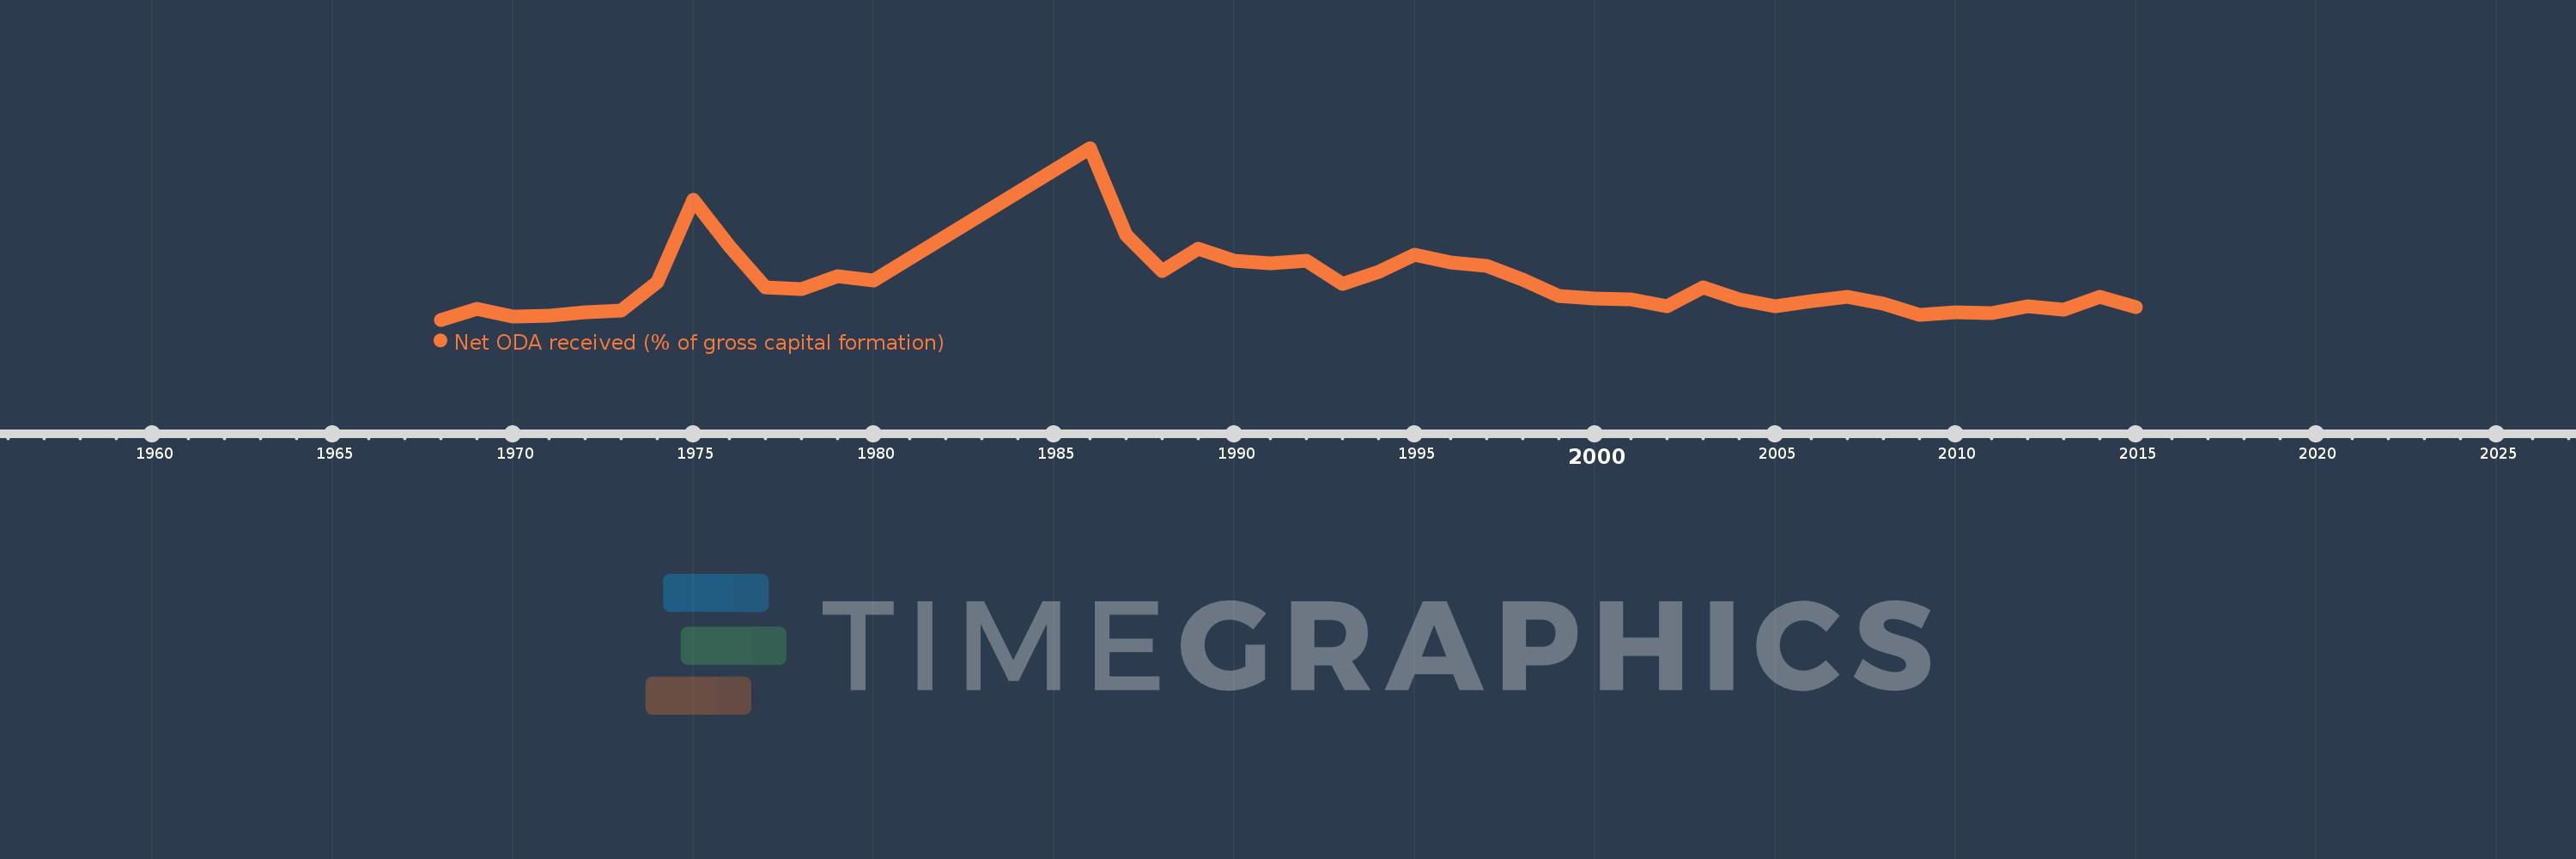
Net ODA received (% of gross capital formation)
2015,2014,2013,2012,2011,2010,2009,2008,2007,2006,2005,2004,2003,2002,2001,2000,1999,1998,1997,1996,1995,1994,1993,1992,1991,1990,1989,1988,1987,1986,1980,1979,1978,1977,1976,1975,1974,1973,1972,1971,1970,1969,1968
This statistics in other country:
AfghanistanAlbaniaAlgeriaAngolaAntigua and BarbudaArab WorldArgentinaArmeniaArubaAzerbaijanBahamas, TheBahrainBangladeshBarbadosBelarusBelizeBeninBhutanBoliviaBosnia and HerzegovinaBotswanaBrazilBrunei DarussalamBurkina FasoBurundiCabo VerdeCambodiaCameroonCaribbean small statesCentral African RepublicCentral Europe and the BalticsChadChileChinaColombiaComorosCongo, Dem. Rep.Congo, Rep.Costa RicaCote d'IvoireCroatiaCubaCyprusDjiboutiDominicaDominican RepublicEast Asia & PacificEast Asia & Pacific (excluding high income)East Asia & Pacific (IDA & IBRD countries)EcuadorEgypt, Arab Rep.El SalvadorEquatorial GuineaEritreaEthiopiaEuro areaEurope & Central AsiaEurope & Central Asia (excluding high income)Europe & Central Asia (IDA & IBRD countries)European UnionFijiFragile and conflict affected situationsGabonGambia, TheGeorgiaGhanaGrenadaGuatemalaGuineaGuinea-BissauGuyanaHaitiHeavily indebted poor countries (HIPC)High incomeHondurasHong Kong SAR, ChinaIBRD onlyIDA & IBRD totalIDA blendIDA onlyIDA totalIndiaIndonesiaIran, Islamic Rep.IraqIsraelJamaicaJordanKazakhstanKenyaKiribatiKorea, Rep.KosovoKuwaitKyrgyz RepublicLao PDRLatin America & Caribbean Latin America & Caribbean (excluding high income)Latin America & the Caribbean (IDA & IBRD countries)Least developed countries: UN classificationLebanonLesothoLiberiaLibyaLow & middle incomeLow incomeLower middle incomeMacao SAR, ChinaMacedonia, FYRMadagascarMalawiMalaysiaMaldivesMaliMaltaMauritaniaMauritiusMexicoMiddle East & North AfricaMiddle East & North Africa (excluding high income)Middle East & North Africa (IDA & IBRD countries)Middle incomeMoldovaMongoliaMontenegroMoroccoMozambiqueNamibiaNepalNew CaledoniaNicaraguaNigerNigeriaNorth AmericaOECD membersOmanOther small statesPakistanPanamaPapua New GuineaParaguayPeruPhilippinesQatarRwandaSaudi ArabiaSenegalSerbiaSeychellesSierra LeoneSingaporeSloveniaSmall statesSolomon IslandsSouth AfricaSouth AsiaSouth Asia (IDA & IBRD)South SudanSri LankaSt. Kitts and NevisSt. LuciaSt. Vincent and the GrenadinesSub-Saharan Africa Sub-Saharan Africa (excluding high income)Sub-Saharan Africa (IDA & IBRD countries)SudanSurinameSwazilandSyrian Arab RepublicTajikistanTanzaniaThailandTimor-LesteTogoTongaTrinidad and TobagoTunisiaTurkeyTurkmenistanUgandaUkraineUpper middle incomeUruguayUzbekistanVanuatuVenezuela, RBVietnamWest Bank and GazaWorldYemen, Rep.ZambiaZimbabwe Timeline:
This timeline shows a graph from 1968 to 2015 of Mali. No data until 1967. Number of actual observations by date: 43.
Source name:
World Development Indicators
Source organization:
Development Assistance Committee of the Organisation for Economic Co-operation and Development, Geographical Distribution of Financial Flows to Developing Countries, Development Co-operation Report, and International Development Statistics database. Data are available online at: www.oecd.org/dac/stats/idsonline. World Bank gross capital formation estimates are used for the denominator.
Categories, topics:
Aid Effectiveness
Last updated:
apr 23, 2017
Indicators value changes by year
Minimum:
35.897
jan 1, 1968
Maximum:
211.776
jan 1, 1986
At the date of observation
Value
Absolute change
Change from previous value
jan 1, 1968
35.897
+35.897
0.0%
jan 1, 1969
47.496
+11.599
32.31%
jan 1, 1970
39.393
-8.103
-17.06%
jan 1, 1971
40.19
+0.797
2.02%
jan 1, 1972
43.347
+3.156
7.85%
jan 1, 1973
45.475
+2.129
4.91%
jan 1, 1974
74.179
+28.704
63.12%
jan 1, 1975
158.953
+84.774
114.28%
jan 1, 1976
111.655
-47.298
-29.76%
jan 1, 1977
69.348
-42.307
-37.89%
jan 1, 1978
67.337
-2.011
-2.9%
jan 1, 1979
80.708
+13.371
19.86%
jan 1, 1980
75.959
-4.749
-5.88%
jan 1, 1986
211.776
+135.817
178.8%
jan 1, 1987
122.899
-88.877
-41.97%
jan 1, 1988
85.486
-37.412
-30.44%
jan 1, 1989
108.495
+23.009
26.92%
jan 1, 1990
96.049
-12.446
-11.47%
jan 1, 1991
93.586
-2.463
-2.56%
jan 1, 1992
96.452
+2.866
3.06%
jan 1, 1993
72.915
-23.536
-24.4%
jan 1, 1994
84.771
+11.856
16.26%
jan 1, 1995
102.145
+17.374
20.5%
jan 1, 1996
94.224
-7.921
-7.75%
jan 1, 1997
90.819
-3.405
-3.61%
jan 1, 1998
76.928
-13.891
-15.3%
jan 1, 1999
59.946
-16.982
-22.08%
jan 1, 2000
57.565
-2.381
-3.97%
jan 1, 2001
56.761
-0.804
-1.4%
jan 1, 2002
49.549
-7.212
-12.71%
jan 1, 2003
69.386
+19.837
40.04%
jan 1, 2004
57.125
-12.261
-17.67%
jan 1, 2005
49.919
-7.206
-12.61%
jan 1, 2006
55.313
+5.393
10.8%
jan 1, 2007
59.21
+3.897
7.05%
jan 1, 2008
52.382
-6.828
-11.53%
jan 1, 2009
40.795
-11.587
-22.12%
jan 1, 2010
43.908
+3.113
7.63%
jan 1, 2011
42.442
-1.465
-3.34%
jan 1, 2012
49.513
+7.07
16.66%
jan 1, 2013
46.484
-3.029
-6.12%
jan 1, 2014
59.285
+12.801
27.54%
jan 1, 2015
48.626
-10.659
-17.98%
Ranking of countries by current statistics by years


Comments: