29
/
en
AIzaSyAYiBZKx7MnpbEhh9jyipgxe19OcubqV5w
April 1, 2024
162949
Jamaica
JAM
true
2
1
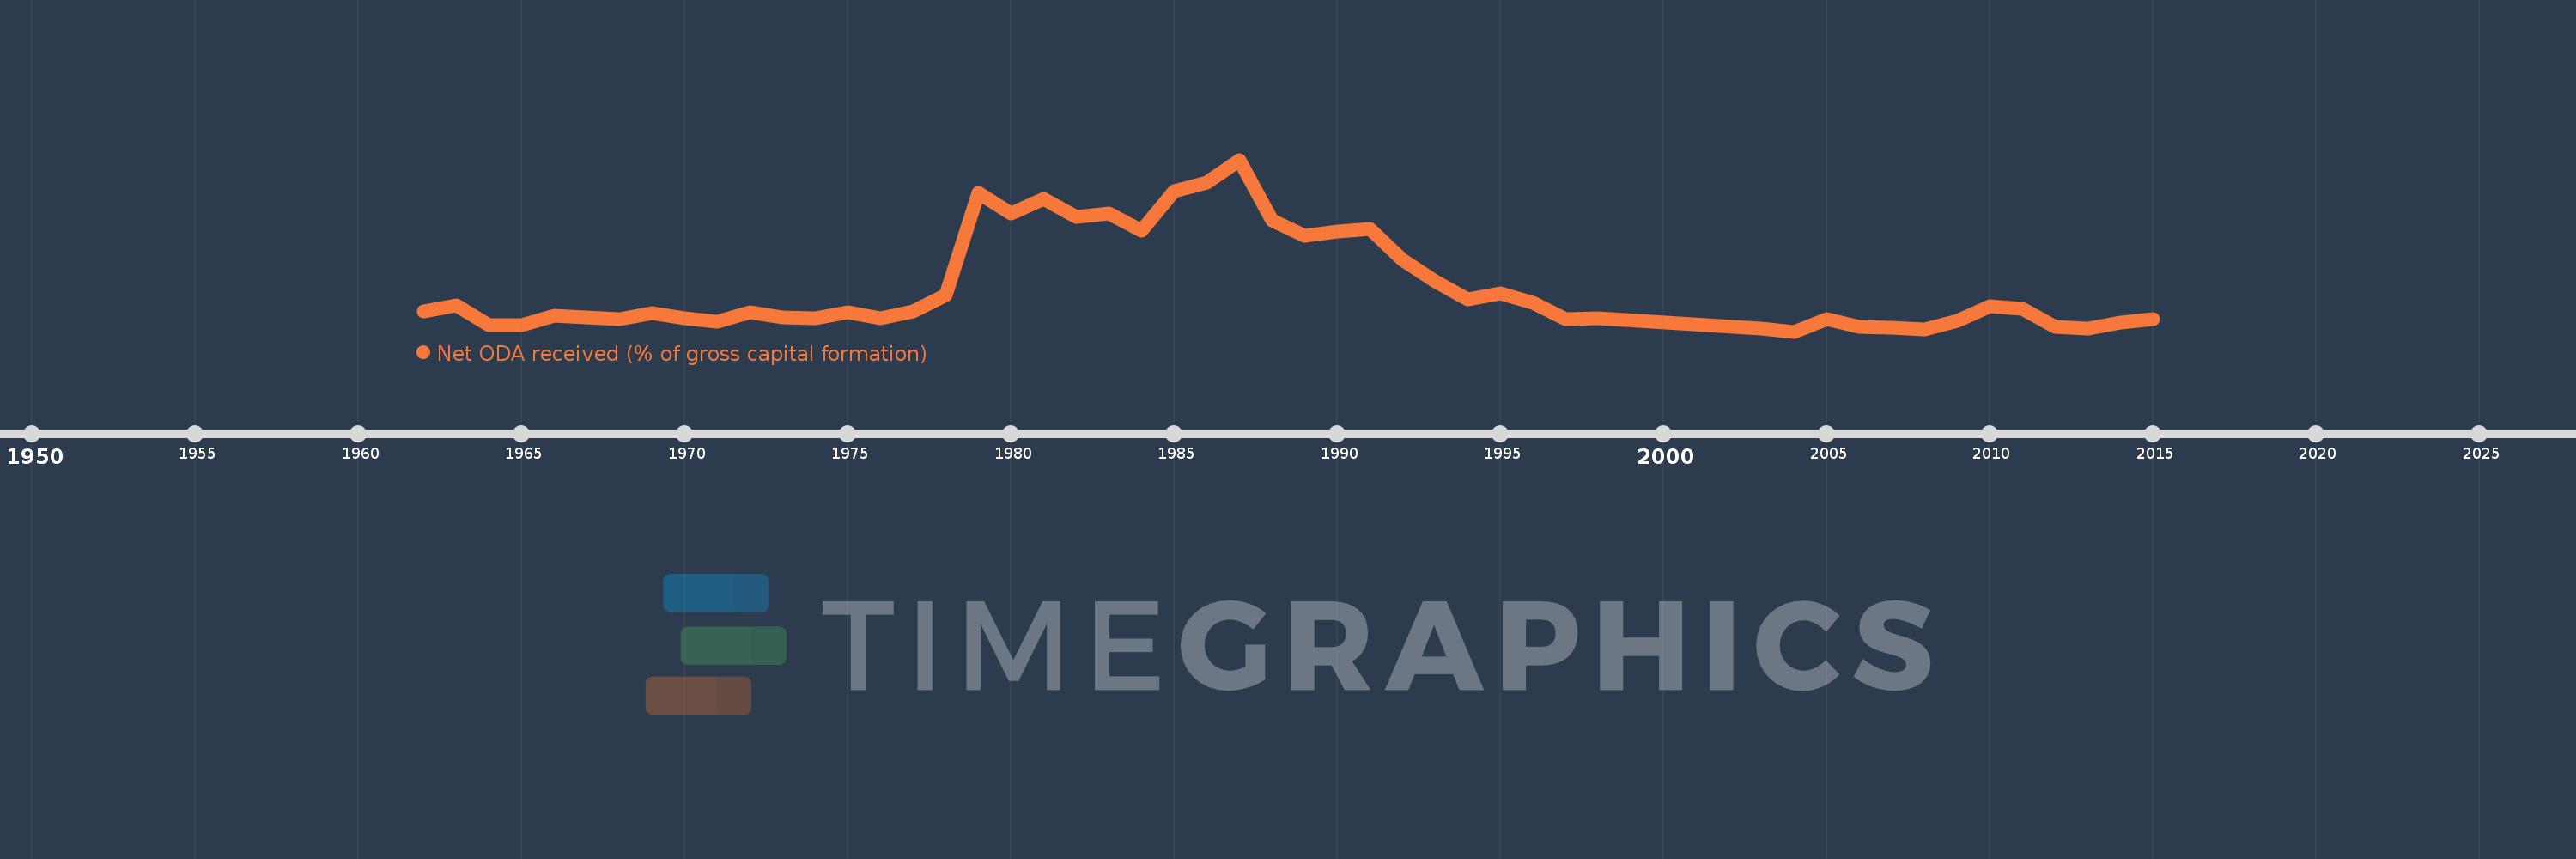
Net ODA received (% of gross capital formation)
2015,2014,2013,2012,2011,2010,2009,2008,2007,2006,2005,2004,2003,1998,1997,1996,1995,1994,1993,1992,1991,1990,1989,1988,1987,1986,1985,1984,1983,1982,1981,1980,1979,1978,1977,1976,1975,1974,1973,1972,1971,1970,1969,1968,1967,1966,1965,1964,1963,1962
This statistics in other country:
AfghanistanAlbaniaAlgeriaAngolaAntigua and BarbudaArab WorldArgentinaArmeniaArubaAzerbaijanBahamas, TheBahrainBangladeshBarbadosBelarusBelizeBeninBhutanBoliviaBosnia and HerzegovinaBotswanaBrazilBrunei DarussalamBurkina FasoBurundiCabo VerdeCambodiaCameroonCaribbean small statesCentral African RepublicCentral Europe and the BalticsChadChileChinaColombiaComorosCongo, Dem. Rep.Congo, Rep.Costa RicaCote d'IvoireCroatiaCubaCyprusDjiboutiDominicaDominican RepublicEast Asia & PacificEast Asia & Pacific (excluding high income)East Asia & Pacific (IDA & IBRD countries)EcuadorEgypt, Arab Rep.El SalvadorEquatorial GuineaEritreaEthiopiaEuro areaEurope & Central AsiaEurope & Central Asia (excluding high income)Europe & Central Asia (IDA & IBRD countries)European UnionFijiFragile and conflict affected situationsGabonGambia, TheGeorgiaGhanaGrenadaGuatemalaGuineaGuinea-BissauGuyanaHaitiHeavily indebted poor countries (HIPC)High incomeHondurasHong Kong SAR, ChinaIBRD onlyIDA & IBRD totalIDA blendIDA onlyIDA totalIndiaIndonesiaIran, Islamic Rep.IraqIsraelJamaicaJordanKazakhstanKenyaKiribatiKorea, Rep.KosovoKuwaitKyrgyz RepublicLao PDRLatin America & Caribbean Latin America & Caribbean (excluding high income)Latin America & the Caribbean (IDA & IBRD countries)Least developed countries: UN classificationLebanonLesothoLiberiaLibyaLow & middle incomeLow incomeLower middle incomeMacao SAR, ChinaMacedonia, FYRMadagascarMalawiMalaysiaMaldivesMaliMaltaMauritaniaMauritiusMexicoMiddle East & North AfricaMiddle East & North Africa (excluding high income)Middle East & North Africa (IDA & IBRD countries)Middle incomeMoldovaMongoliaMontenegroMoroccoMozambiqueNamibiaNepalNew CaledoniaNicaraguaNigerNigeriaNorth AmericaOECD membersOmanOther small statesPakistanPanamaPapua New GuineaParaguayPeruPhilippinesQatarRwandaSaudi ArabiaSenegalSerbiaSeychellesSierra LeoneSingaporeSloveniaSmall statesSolomon IslandsSouth AfricaSouth AsiaSouth Asia (IDA & IBRD)South SudanSri LankaSt. Kitts and NevisSt. LuciaSt. Vincent and the GrenadinesSub-Saharan Africa Sub-Saharan Africa (excluding high income)Sub-Saharan Africa (IDA & IBRD countries)SudanSurinameSwazilandSyrian Arab RepublicTajikistanTanzaniaThailandTimor-LesteTogoTongaTrinidad and TobagoTunisiaTurkeyTurkmenistanUgandaUkraineUpper middle incomeUruguayUzbekistanVanuatuVenezuela, RBVietnamWest Bank and GazaWorldYemen, Rep.ZambiaZimbabwe Timeline:
This timeline shows a graph from 1962 to 2015 of Jamaica. No data until 1961. Number of actual observations by date: 50.
Source name:
World Development Indicators
Source organization:
Development Assistance Committee of the Organisation for Economic Co-operation and Development, Geographical Distribution of Financial Flows to Developing Countries, Development Co-operation Report, and International Development Statistics database. Data are available online at: www.oecd.org/dac/stats/idsonline. World Bank gross capital formation estimates are used for the denominator.
Categories, topics:
Aid Effectiveness
Last updated:
apr 23, 2017
Indicators value changes by year
Maximum:
37.959
jan 1, 1987
At the date of observation
Value
Absolute change
Change from previous value
jan 1, 1962
4.764
+4.764
0.0%
jan 1, 1963
6.064
+1.3
27.28%
jan 1, 1964
1.727
-4.337
-71.52%
jan 1, 1965
1.655
-0.072
-4.18%
jan 1, 1966
3.83
+2.175
131.45%
jan 1, 1967
3.326
-0.504
-13.15%
jan 1, 1968
2.904
-0.422
-12.68%
jan 1, 1969
4.249
+1.345
46.3%
jan 1, 1970
3.168
-1.08
-25.42%
jan 1, 1971
2.37
-0.799
-25.2%
jan 1, 1972
4.487
+2.117
89.32%
jan 1, 1973
3.307
-1.18
-26.3%
jan 1, 1974
3.151
-0.156
-4.71%
jan 1, 1975
4.476
+1.325
42.05%
jan 1, 1976
3.271
-1.205
-26.93%
jan 1, 1977
4.783
+1.512
46.24%
jan 1, 1978
8.308
+3.525
73.69%
jan 1, 1979
30.629
+22.32
268.65%
jan 1, 1980
26.235
-4.394
-14.35%
jan 1, 1981
29.389
+3.154
12.02%
jan 1, 1982
25.461
-3.928
-13.37%
jan 1, 1983
26.116
+0.655
2.57%
jan 1, 1984
22.379
-3.736
-14.31%
jan 1, 1985
30.986
+8.607
38.46%
jan 1, 1986
33.025
+2.039
6.58%
jan 1, 1987
37.959
+4.934
14.94%
jan 1, 1988
24.606
-13.353
-35.18%
jan 1, 1989
21.242
-3.364
-13.67%
jan 1, 1990
22.311
+1.069
5.03%
jan 1, 1991
22.767
+0.456
2.04%
jan 1, 1992
16.072
-6.695
-29.41%
jan 1, 1993
11.229
-4.842
-30.13%
jan 1, 1994
7.244
-3.986
-35.49%
jan 1, 1995
8.702
+1.458
20.13%
jan 1, 1996
6.489
-2.212
-25.42%
jan 1, 1997
3.054
-3.435
-52.94%
jan 1, 1998
3.278
+0.224
7.34%
jan 1, 2003
0.906
-2.372
-72.35%
jan 1, 2004
0.264
-0.642
-70.84%
jan 1, 2005
3.076
+2.811
1.06K%
jan 1, 2006
1.311
-1.764
-57.36%
jan 1, 2007
1.099
-0.212
-16.2%
jan 1, 2008
0.824
-0.275
-25.02%
jan 1, 2009
2.576
+1.752
212.63%
jan 1, 2010
5.889
+3.313
128.6%
jan 1, 2011
5.288
-0.602
-10.21%
jan 1, 2012
1.259
-4.029
-76.19%
jan 1, 2013
0.901
-0.358
-28.41%
jan 1, 2014
2.311
+1.41
156.4%
jan 1, 2015
2.955
+0.644
27.87%
Ranking of countries by current statistics by years


Comments: