29
/
en
AIzaSyAYiBZKx7MnpbEhh9jyipgxe19OcubqV5w
April 1, 2024
66393
Algeria
DZA
true
2
1
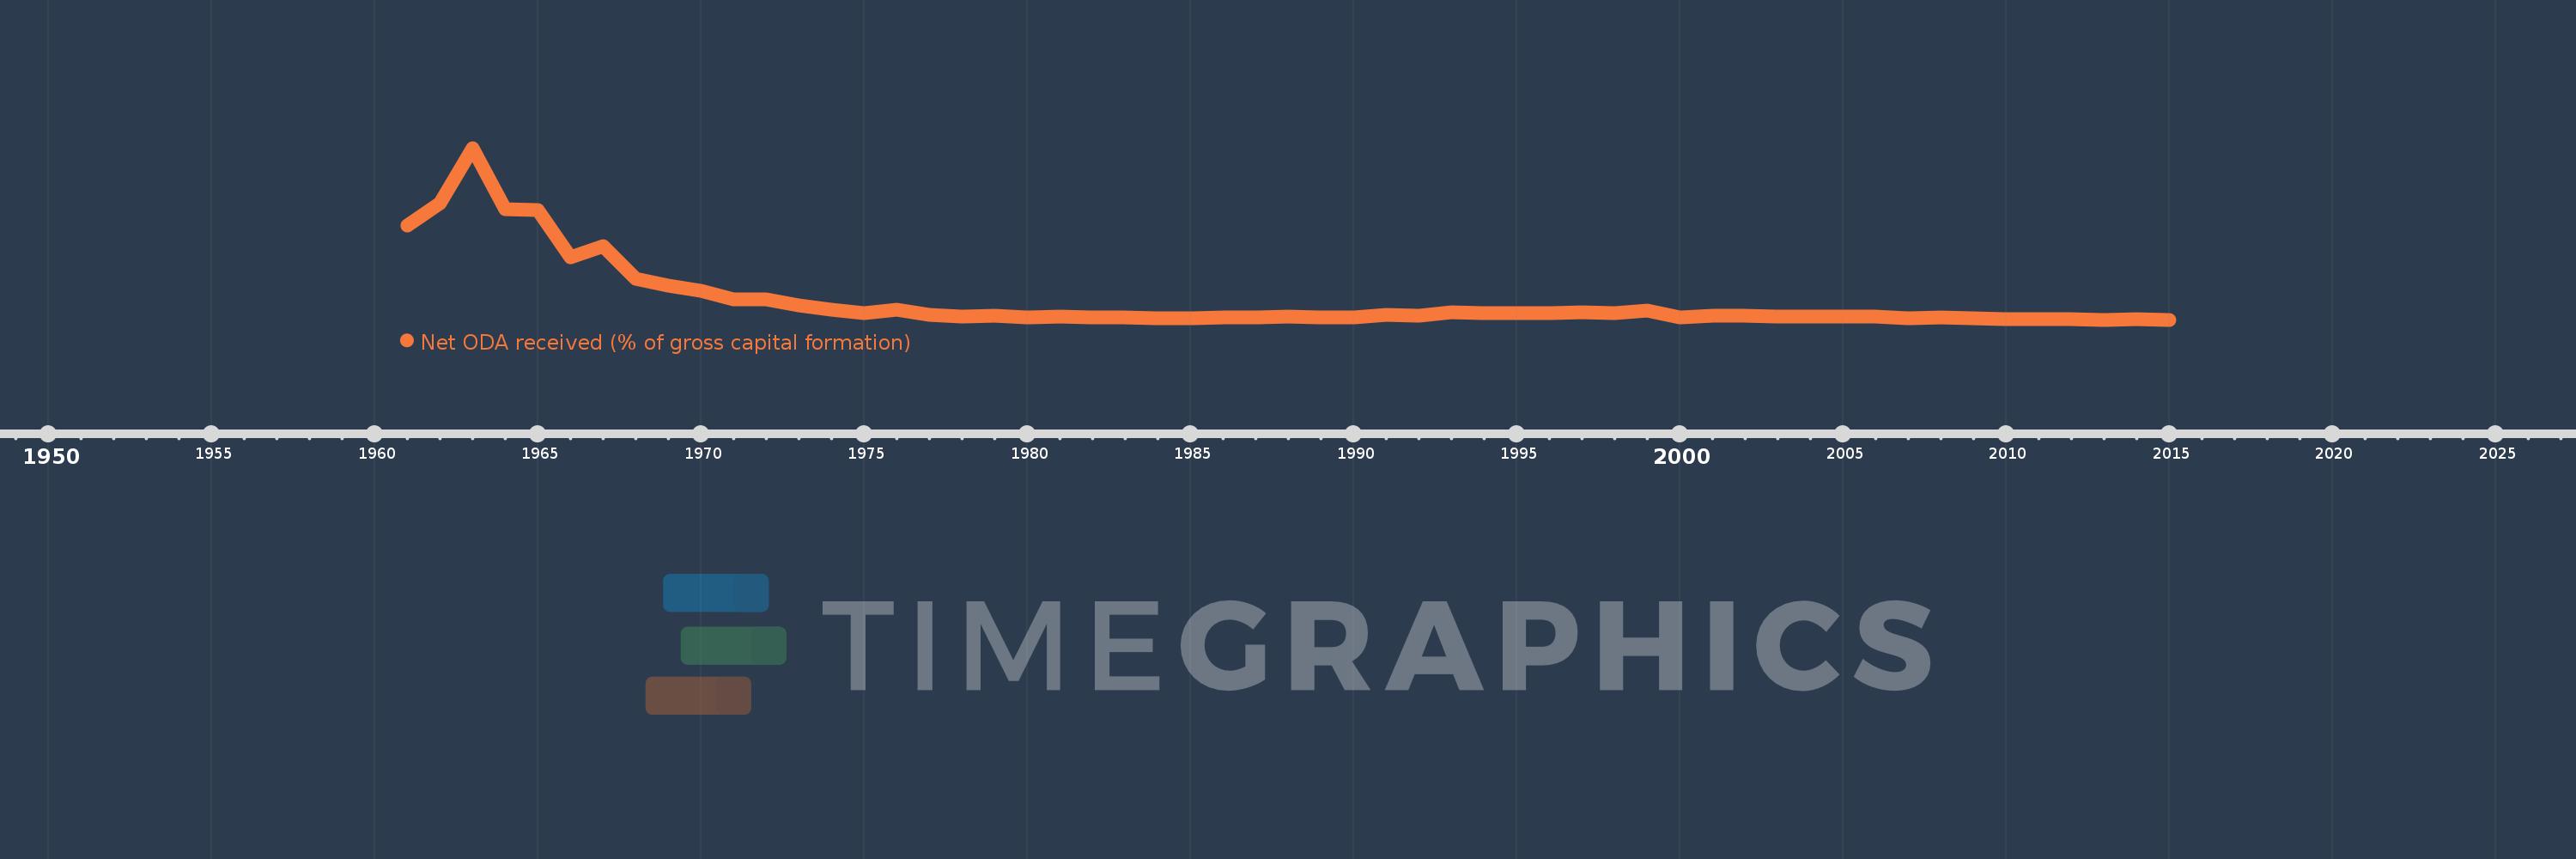
Net ODA received (% of gross capital formation)
2015,2014,2013,2012,2011,2010,2009,2008,2007,2006,2005,2004,2003,2002,2001,2000,1999,1998,1997,1996,1995,1994,1993,1992,1991,1990,1989,1988,1987,1986,1985,1984,1983,1982,1981,1980,1979,1978,1977,1976,1975,1974,1973,1972,1971,1970,1969,1968,1967,1966,1965,1964,1963,1962,1961
This statistics in other country:
AfghanistanAlbaniaAlgeriaAngolaAntigua and BarbudaArab WorldArgentinaArmeniaArubaAzerbaijanBahamas, TheBahrainBangladeshBarbadosBelarusBelizeBeninBhutanBoliviaBosnia and HerzegovinaBotswanaBrazilBrunei DarussalamBurkina FasoBurundiCabo VerdeCambodiaCameroonCaribbean small statesCentral African RepublicCentral Europe and the BalticsChadChileChinaColombiaComorosCongo, Dem. Rep.Congo, Rep.Costa RicaCote d'IvoireCroatiaCubaCyprusDjiboutiDominicaDominican RepublicEast Asia & PacificEast Asia & Pacific (excluding high income)East Asia & Pacific (IDA & IBRD countries)EcuadorEgypt, Arab Rep.El SalvadorEquatorial GuineaEritreaEthiopiaEuro areaEurope & Central AsiaEurope & Central Asia (excluding high income)Europe & Central Asia (IDA & IBRD countries)European UnionFijiFragile and conflict affected situationsGabonGambia, TheGeorgiaGhanaGrenadaGuatemalaGuineaGuinea-BissauGuyanaHaitiHeavily indebted poor countries (HIPC)High incomeHondurasHong Kong SAR, ChinaIBRD onlyIDA & IBRD totalIDA blendIDA onlyIDA totalIndiaIndonesiaIran, Islamic Rep.IraqIsraelJamaicaJordanKazakhstanKenyaKiribatiKorea, Rep.KosovoKuwaitKyrgyz RepublicLao PDRLatin America & Caribbean Latin America & Caribbean (excluding high income)Latin America & the Caribbean (IDA & IBRD countries)Least developed countries: UN classificationLebanonLesothoLiberiaLibyaLow & middle incomeLow incomeLower middle incomeMacao SAR, ChinaMacedonia, FYRMadagascarMalawiMalaysiaMaldivesMaliMaltaMauritaniaMauritiusMexicoMiddle East & North AfricaMiddle East & North Africa (excluding high income)Middle East & North Africa (IDA & IBRD countries)Middle incomeMoldovaMongoliaMontenegroMoroccoMozambiqueNamibiaNepalNew CaledoniaNicaraguaNigerNigeriaNorth AmericaOECD membersOmanOther small statesPakistanPanamaPapua New GuineaParaguayPeruPhilippinesQatarRwandaSaudi ArabiaSenegalSerbiaSeychellesSierra LeoneSingaporeSloveniaSmall statesSolomon IslandsSouth AfricaSouth AsiaSouth Asia (IDA & IBRD)South SudanSri LankaSt. Kitts and NevisSt. LuciaSt. Vincent and the GrenadinesSub-Saharan Africa Sub-Saharan Africa (excluding high income)Sub-Saharan Africa (IDA & IBRD countries)SudanSurinameSwazilandSyrian Arab RepublicTajikistanTanzaniaThailandTimor-LesteTogoTongaTrinidad and TobagoTunisiaTurkeyTurkmenistanUgandaUkraineUpper middle incomeUruguayUzbekistanVanuatuVenezuela, RBVietnamWest Bank and GazaWorldYemen, Rep.ZambiaZimbabwe Timeline:
This timeline shows a graph from 1961 to 2015 of Algeria. No data until 1960. Number of actual observations by date: 55.
Source name:
World Development Indicators
Source organization:
Development Assistance Committee of the Organisation for Economic Co-operation and Development, Geographical Distribution of Financial Flows to Developing Countries, Development Co-operation Report, and International Development Statistics database. Data are available online at: www.oecd.org/dac/stats/idsonline. World Bank gross capital formation estimates are used for the denominator.
Categories, topics:
Aid Effectiveness
Last updated:
apr 23, 2017
Indicators value changes by year
Maximum:
56.089
jan 1, 1963
At the date of observation
Value
Absolute change
Change from previous value
jan 1, 1961
30.902
+30.902
0.0%
jan 1, 1962
38.114
+7.212
23.34%
jan 1, 1963
56.089
+17.975
47.16%
jan 1, 1964
36.038
-20.051
-35.75%
jan 1, 1965
35.847
-0.191
-0.53%
jan 1, 1966
20.627
-15.22
-42.46%
jan 1, 1967
24.1
+3.473
16.84%
jan 1, 1968
13.626
-10.474
-43.46%
jan 1, 1969
11.142
-2.484
-18.23%
jan 1, 1970
9.528
-1.614
-14.49%
jan 1, 1971
6.856
-2.671
-28.04%
jan 1, 1972
6.754
-0.102
-1.49%
jan 1, 1973
4.755
-1.999
-29.59%
jan 1, 1974
3.563
-1.192
-25.07%
jan 1, 1975
2.428
-1.135
-31.86%
jan 1, 1976
3.33
+0.903
37.18%
jan 1, 1977
1.892
-1.439
-43.2%
jan 1, 1978
1.313
-0.579
-30.6%
jan 1, 1979
1.382
+0.07
5.3%
jan 1, 1980
0.784
-0.599
-43.3%
jan 1, 1981
1.24
+0.456
58.21%
jan 1, 1982
1.018
-0.221
-17.86%
jan 1, 1983
0.799
-0.219
-21.53%
jan 1, 1984
0.509
-0.29
-36.34%
jan 1, 1985
0.641
+0.132
25.93%
jan 1, 1986
0.86
+0.219
34.15%
jan 1, 1987
0.783
-0.077
-8.92%
jan 1, 1988
1.161
+0.378
48.25%
jan 1, 1989
1.053
-0.108
-9.27%
jan 1, 1990
0.946
-0.107
-10.2%
jan 1, 1991
1.87
+0.924
97.71%
jan 1, 1992
1.451
-0.419
-22.41%
jan 1, 1993
2.523
+1.072
73.89%
jan 1, 1994
2.233
-0.29
-11.48%
jan 1, 1995
2.295
+0.062
2.76%
jan 1, 1996
2.277
-0.018
-0.78%
jan 1, 1997
2.531
+0.254
11.15%
jan 1, 1998
2.291
-0.239
-9.45%
jan 1, 1999
3.208
+0.917
40.01%
jan 1, 2000
0.994
-2.214
-69.0%
jan 1, 2001
1.456
+0.461
46.41%
jan 1, 2002
1.352
-0.104
-7.13%
jan 1, 2003
1.092
-0.26
-19.25%
jan 1, 2004
1.156
+0.065
5.92%
jan 1, 2005
1.114
-0.042
-3.66%
jan 1, 2006
1.061
-0.053
-4.77%
jan 1, 2007
0.679
-0.381
-35.96%
jan 1, 2008
0.847
+0.168
24.72%
jan 1, 2009
0.509
-0.339
-39.95%
jan 1, 2010
0.494
-0.015
-3.01%
jan 1, 2011
0.297
-0.197
-39.84%
jan 1, 2012
0.251
-0.046
-15.48%
jan 1, 2013
0.177
-0.074
-29.56%
jan 1, 2014
0.221
+0.044
24.75%
jan 1, 2015
0.162
-0.059
-26.59%
Ranking of countries by current statistics by years


Comments: