29
/
en
AIzaSyAYiBZKx7MnpbEhh9jyipgxe19OcubqV5w
April 1, 2024
90170
Botswana
BWA
true
2
1
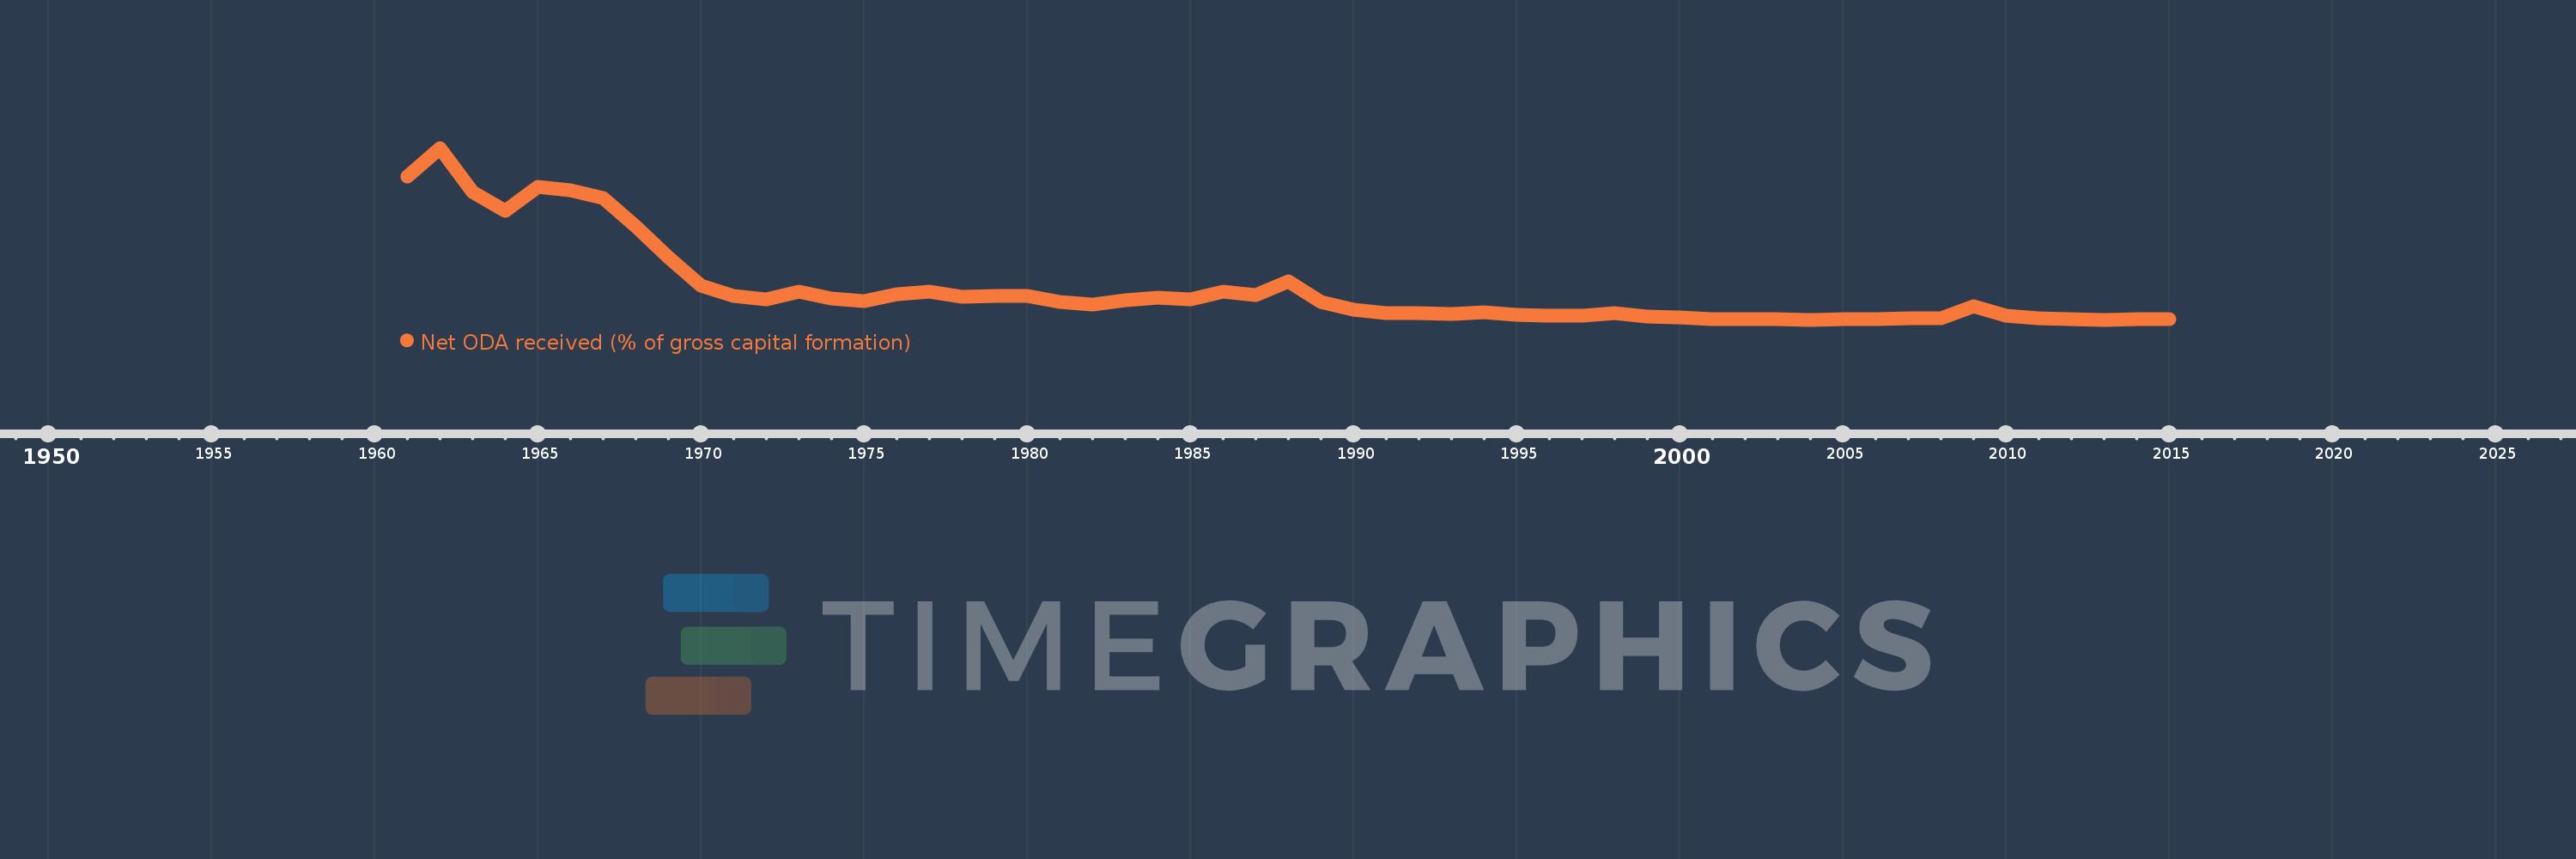
Net ODA received (% of gross capital formation)
2015,2014,2013,2012,2011,2010,2009,2008,2007,2006,2005,2004,2003,2002,2001,2000,1999,1998,1997,1996,1995,1994,1993,1992,1991,1990,1989,1988,1987,1986,1985,1984,1983,1982,1981,1980,1979,1978,1977,1976,1975,1974,1973,1972,1971,1970,1969,1968,1967,1966,1965,1964,1963,1962,1961
This statistics in other country:
AfghanistanAlbaniaAlgeriaAngolaAntigua and BarbudaArab WorldArgentinaArmeniaArubaAzerbaijanBahamas, TheBahrainBangladeshBarbadosBelarusBelizeBeninBhutanBoliviaBosnia and HerzegovinaBotswanaBrazilBrunei DarussalamBurkina FasoBurundiCabo VerdeCambodiaCameroonCaribbean small statesCentral African RepublicCentral Europe and the BalticsChadChileChinaColombiaComorosCongo, Dem. Rep.Congo, Rep.Costa RicaCote d'IvoireCroatiaCubaCyprusDjiboutiDominicaDominican RepublicEast Asia & PacificEast Asia & Pacific (excluding high income)East Asia & Pacific (IDA & IBRD countries)EcuadorEgypt, Arab Rep.El SalvadorEquatorial GuineaEritreaEthiopiaEuro areaEurope & Central AsiaEurope & Central Asia (excluding high income)Europe & Central Asia (IDA & IBRD countries)European UnionFijiFragile and conflict affected situationsGabonGambia, TheGeorgiaGhanaGrenadaGuatemalaGuineaGuinea-BissauGuyanaHaitiHeavily indebted poor countries (HIPC)High incomeHondurasHong Kong SAR, ChinaIBRD onlyIDA & IBRD totalIDA blendIDA onlyIDA totalIndiaIndonesiaIran, Islamic Rep.IraqIsraelJamaicaJordanKazakhstanKenyaKiribatiKorea, Rep.KosovoKuwaitKyrgyz RepublicLao PDRLatin America & Caribbean Latin America & Caribbean (excluding high income)Latin America & the Caribbean (IDA & IBRD countries)Least developed countries: UN classificationLebanonLesothoLiberiaLibyaLow & middle incomeLow incomeLower middle incomeMacao SAR, ChinaMacedonia, FYRMadagascarMalawiMalaysiaMaldivesMaliMaltaMauritaniaMauritiusMexicoMiddle East & North AfricaMiddle East & North Africa (excluding high income)Middle East & North Africa (IDA & IBRD countries)Middle incomeMoldovaMongoliaMontenegroMoroccoMozambiqueNamibiaNepalNew CaledoniaNicaraguaNigerNigeriaNorth AmericaOECD membersOmanOther small statesPakistanPanamaPapua New GuineaParaguayPeruPhilippinesQatarRwandaSaudi ArabiaSenegalSerbiaSeychellesSierra LeoneSingaporeSloveniaSmall statesSolomon IslandsSouth AfricaSouth AsiaSouth Asia (IDA & IBRD)South SudanSri LankaSt. Kitts and NevisSt. LuciaSt. Vincent and the GrenadinesSub-Saharan Africa Sub-Saharan Africa (excluding high income)Sub-Saharan Africa (IDA & IBRD countries)SudanSurinameSwazilandSyrian Arab RepublicTajikistanTanzaniaThailandTimor-LesteTogoTongaTrinidad and TobagoTunisiaTurkeyTurkmenistanUgandaUkraineUpper middle incomeUruguayUzbekistanVanuatuVenezuela, RBVietnamWest Bank and GazaWorldYemen, Rep.ZambiaZimbabwe Timeline:
This timeline shows a graph from 1961 to 2015 of Botswana. No data until 1960. Number of actual observations by date: 55.
Source name:
World Development Indicators
Source organization:
Development Assistance Committee of the Organisation for Economic Co-operation and Development, Geographical Distribution of Financial Flows to Developing Countries, Development Co-operation Report, and International Development Statistics database. Data are available online at: www.oecd.org/dac/stats/idsonline. World Bank gross capital formation estimates are used for the denominator.
Categories, topics:
Aid Effectiveness
Last updated:
apr 23, 2017
Indicators value changes by year
Maximum:
224.266
jan 1, 1962
At the date of observation
Value
Absolute change
Change from previous value
jan 1, 1961
187.486
+187.486
0.0%
jan 1, 1962
224.266
+36.78
19.62%
jan 1, 1963
167.069
-57.197
-25.5%
jan 1, 1964
142.677
-24.392
-14.6%
jan 1, 1965
173.524
+30.847
21.62%
jan 1, 1966
169.615
-3.909
-2.25%
jan 1, 1967
159.25
-10.364
-6.11%
jan 1, 1968
122.368
-36.883
-23.16%
jan 1, 1969
82.209
-40.158
-32.82%
jan 1, 1970
45.145
-37.065
-45.09%
jan 1, 1971
32.554
-12.591
-27.89%
jan 1, 1972
27.562
-4.991
-15.33%
jan 1, 1973
37.31
+9.747
35.37%
jan 1, 1974
29.028
-8.282
-22.2%
jan 1, 1975
24.879
-4.149
-14.29%
jan 1, 1976
34.23
+9.351
37.59%
jan 1, 1977
37.712
+3.481
10.17%
jan 1, 1978
31.263
-6.448
-17.1%
jan 1, 1979
32.032
+0.768
2.46%
jan 1, 1980
32.577
+0.546
1.7%
jan 1, 1981
24.775
-7.803
-23.95%
jan 1, 1982
20.697
-4.077
-16.46%
jan 1, 1983
26.462
+5.764
27.85%
jan 1, 1984
29.933
+3.471
13.12%
jan 1, 1985
27.9
-2.033
-6.79%
jan 1, 1986
37.302
+9.402
33.7%
jan 1, 1987
33.642
-3.66
-9.81%
jan 1, 1988
50.829
+17.187
51.09%
jan 1, 1989
24.018
-26.812
-52.75%
jan 1, 1990
14.184
-9.834
-40.94%
jan 1, 1991
10.252
-3.932
-27.72%
jan 1, 1992
10.01
-0.243
-2.37%
jan 1, 1993
8.821
-1.189
-11.88%
jan 1, 1994
10.85
+2.029
23.0%
jan 1, 1995
7.697
-3.153
-29.06%
jan 1, 1996
6.977
-0.72
-9.36%
jan 1, 1997
6.551
-0.426
-6.1%
jan 1, 1998
10.062
+3.512
53.6%
jan 1, 1999
5.846
-4.216
-41.9%
jan 1, 2000
4.333
-1.514
-25.89%
jan 1, 2001
1.79
-2.542
-58.68%
jan 1, 2002
1.778
-0.012
-0.68%
jan 1, 2003
2.265
+0.487
27.38%
jan 1, 2004
1.23
-1.035
-45.69%
jan 1, 2005
1.78
+0.55
44.68%
jan 1, 2006
1.779
0.0
-0.01%
jan 1, 2007
2.623
+0.844
47.4%
jan 1, 2008
3.196
+0.574
21.86%
jan 1, 2009
18.185
+14.989
468.91%
jan 1, 2010
6.984
-11.201
-61.59%
jan 1, 2011
2.898
-4.086
-58.5%
jan 1, 2012
2.001
-0.897
-30.97%
jan 1, 2013
1.301
-0.7
-34.97%
jan 1, 2014
2.203
+0.902
69.33%
jan 1, 2015
2.049
-0.155
-7.02%
Ranking of countries by current statistics by years


Comments: