29
/
en
AIzaSyAYiBZKx7MnpbEhh9jyipgxe19OcubqV5w
April 1, 2024
112649
Costa Rica
CRI
true
2
1
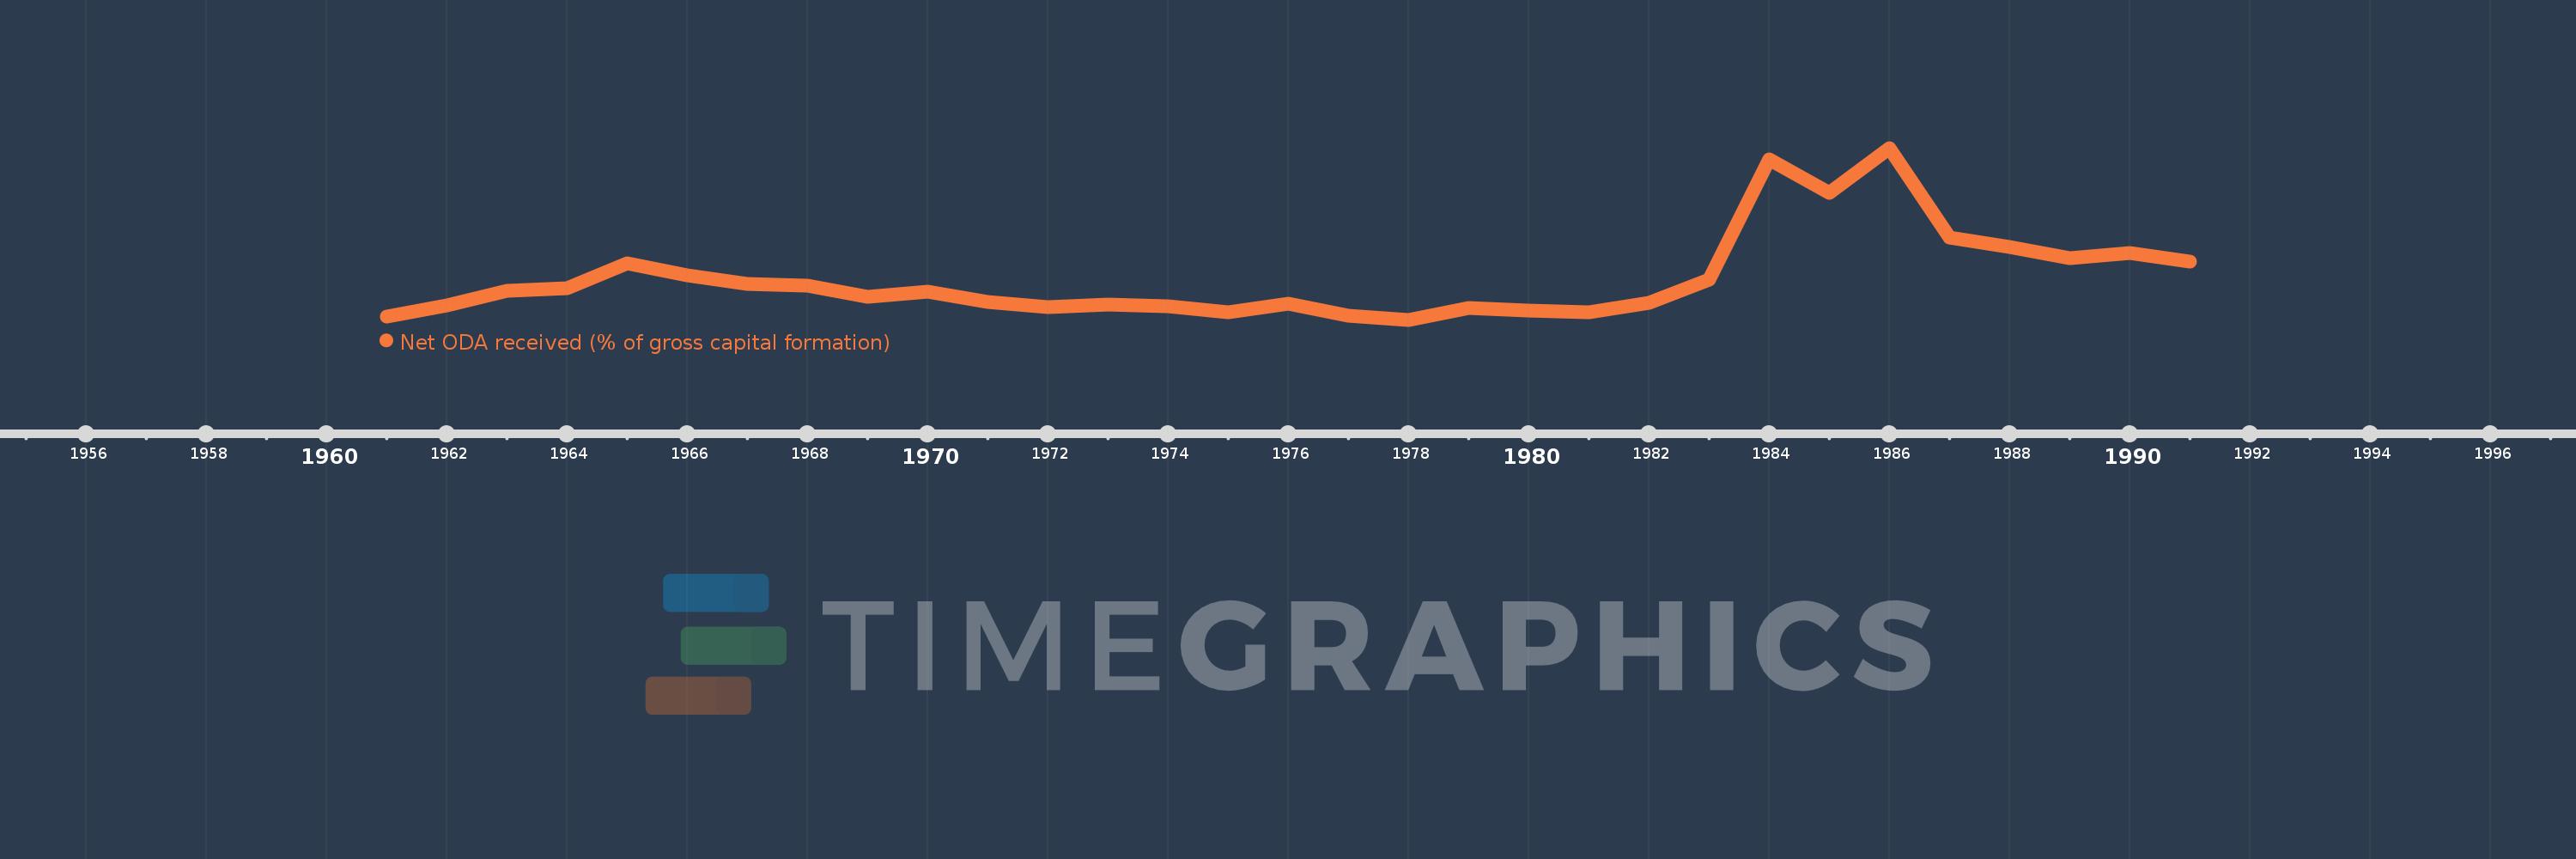
Net ODA received (% of gross capital formation)
1991,1990,1989,1988,1987,1986,1985,1984,1983,1982,1981,1980,1979,1978,1977,1976,1975,1974,1973,1972,1971,1970,1969,1968,1967,1966,1965,1964,1963,1962,1961
This statistics in other country:
AfghanistanAlbaniaAlgeriaAngolaAntigua and BarbudaArab WorldArgentinaArmeniaArubaAzerbaijanBahamas, TheBahrainBangladeshBarbadosBelarusBelizeBeninBhutanBoliviaBosnia and HerzegovinaBotswanaBrazilBrunei DarussalamBurkina FasoBurundiCabo VerdeCambodiaCameroonCaribbean small statesCentral African RepublicCentral Europe and the BalticsChadChileChinaColombiaComorosCongo, Dem. Rep.Congo, Rep.Costa RicaCote d'IvoireCroatiaCubaCyprusDjiboutiDominicaDominican RepublicEast Asia & PacificEast Asia & Pacific (excluding high income)East Asia & Pacific (IDA & IBRD countries)EcuadorEgypt, Arab Rep.El SalvadorEquatorial GuineaEritreaEthiopiaEuro areaEurope & Central AsiaEurope & Central Asia (excluding high income)Europe & Central Asia (IDA & IBRD countries)European UnionFijiFragile and conflict affected situationsGabonGambia, TheGeorgiaGhanaGrenadaGuatemalaGuineaGuinea-BissauGuyanaHaitiHeavily indebted poor countries (HIPC)High incomeHondurasHong Kong SAR, ChinaIBRD onlyIDA & IBRD totalIDA blendIDA onlyIDA totalIndiaIndonesiaIran, Islamic Rep.IraqIsraelJamaicaJordanKazakhstanKenyaKiribatiKorea, Rep.KosovoKuwaitKyrgyz RepublicLao PDRLatin America & Caribbean Latin America & Caribbean (excluding high income)Latin America & the Caribbean (IDA & IBRD countries)Least developed countries: UN classificationLebanonLesothoLiberiaLibyaLow & middle incomeLow incomeLower middle incomeMacao SAR, ChinaMacedonia, FYRMadagascarMalawiMalaysiaMaldivesMaliMaltaMauritaniaMauritiusMexicoMiddle East & North AfricaMiddle East & North Africa (excluding high income)Middle East & North Africa (IDA & IBRD countries)Middle incomeMoldovaMongoliaMontenegroMoroccoMozambiqueNamibiaNepalNew CaledoniaNicaraguaNigerNigeriaNorth AmericaOECD membersOmanOther small statesPakistanPanamaPapua New GuineaParaguayPeruPhilippinesQatarRwandaSaudi ArabiaSenegalSerbiaSeychellesSierra LeoneSingaporeSloveniaSmall statesSolomon IslandsSouth AfricaSouth AsiaSouth Asia (IDA & IBRD)South SudanSri LankaSt. Kitts and NevisSt. LuciaSt. Vincent and the GrenadinesSub-Saharan Africa Sub-Saharan Africa (excluding high income)Sub-Saharan Africa (IDA & IBRD countries)SudanSurinameSwazilandSyrian Arab RepublicTajikistanTanzaniaThailandTimor-LesteTogoTongaTrinidad and TobagoTunisiaTurkeyTurkmenistanUgandaUkraineUpper middle incomeUruguayUzbekistanVanuatuVenezuela, RBVietnamWest Bank and GazaWorldYemen, Rep.ZambiaZimbabwe Timeline:
This timeline shows a graph from 1961 to 1991 of Costa Rica. No data until 1960. Number of actual observations by date: 31.
Source name:
World Development Indicators
Source organization:
Development Assistance Committee of the Organisation for Economic Co-operation and Development, Geographical Distribution of Financial Flows to Developing Countries, Development Co-operation Report, and International Development Statistics database. Data are available online at: www.oecd.org/dac/stats/idsonline. World Bank gross capital formation estimates are used for the denominator.
Categories, topics:
Aid Effectiveness
Last updated:
apr 23, 2017
Indicators value changes by year
Maximum:
42.342
jan 1, 1986
At the date of observation
Value
Absolute change
Change from previous value
jan 1, 1961
4.042
+4.042
0.0%
jan 1, 1962
6.536
+2.494
61.7%
jan 1, 1963
9.977
+3.441
52.64%
jan 1, 1964
10.519
+0.542
5.43%
jan 1, 1965
16.087
+5.568
52.93%
jan 1, 1966
13.411
-2.676
-16.63%
jan 1, 1967
11.454
-1.957
-14.59%
jan 1, 1968
11.02
-0.434
-3.79%
jan 1, 1969
8.538
-2.482
-22.52%
jan 1, 1970
9.656
+1.119
13.11%
jan 1, 1971
7.422
-2.235
-23.14%
jan 1, 1972
6.294
-1.127
-15.19%
jan 1, 1973
6.827
+0.532
8.46%
jan 1, 1974
6.354
-0.472
-6.92%
jan 1, 1975
5.164
-1.191
-18.74%
jan 1, 1976
7.077
+1.913
37.05%
jan 1, 1977
4.264
-2.813
-39.75%
jan 1, 1978
3.378
-0.886
-20.77%
jan 1, 1979
6.123
+2.745
81.24%
jan 1, 1980
5.405
-0.718
-11.73%
jan 1, 1981
5.018
-0.386
-7.15%
jan 1, 1982
7.13
+2.112
42.08%
jan 1, 1983
12.419
+5.289
74.18%
jan 1, 1984
39.824
+27.405
220.68%
jan 1, 1985
32.141
-7.683
-19.29%
jan 1, 1986
42.342
+10.201
31.74%
jan 1, 1987
22.103
-20.24
-47.8%
jan 1, 1988
19.961
-2.142
-9.69%
jan 1, 1989
17.253
-2.707
-13.56%
jan 1, 1990
18.561
+1.308
7.58%
jan 1, 1991
16.592
-1.969
-10.61%
Ranking of countries by current statistics by years


Comments: