29
/
en
AIzaSyAYiBZKx7MnpbEhh9jyipgxe19OcubqV5w
April 1, 2024
102789
Central African Republic
CAF
true
2
1
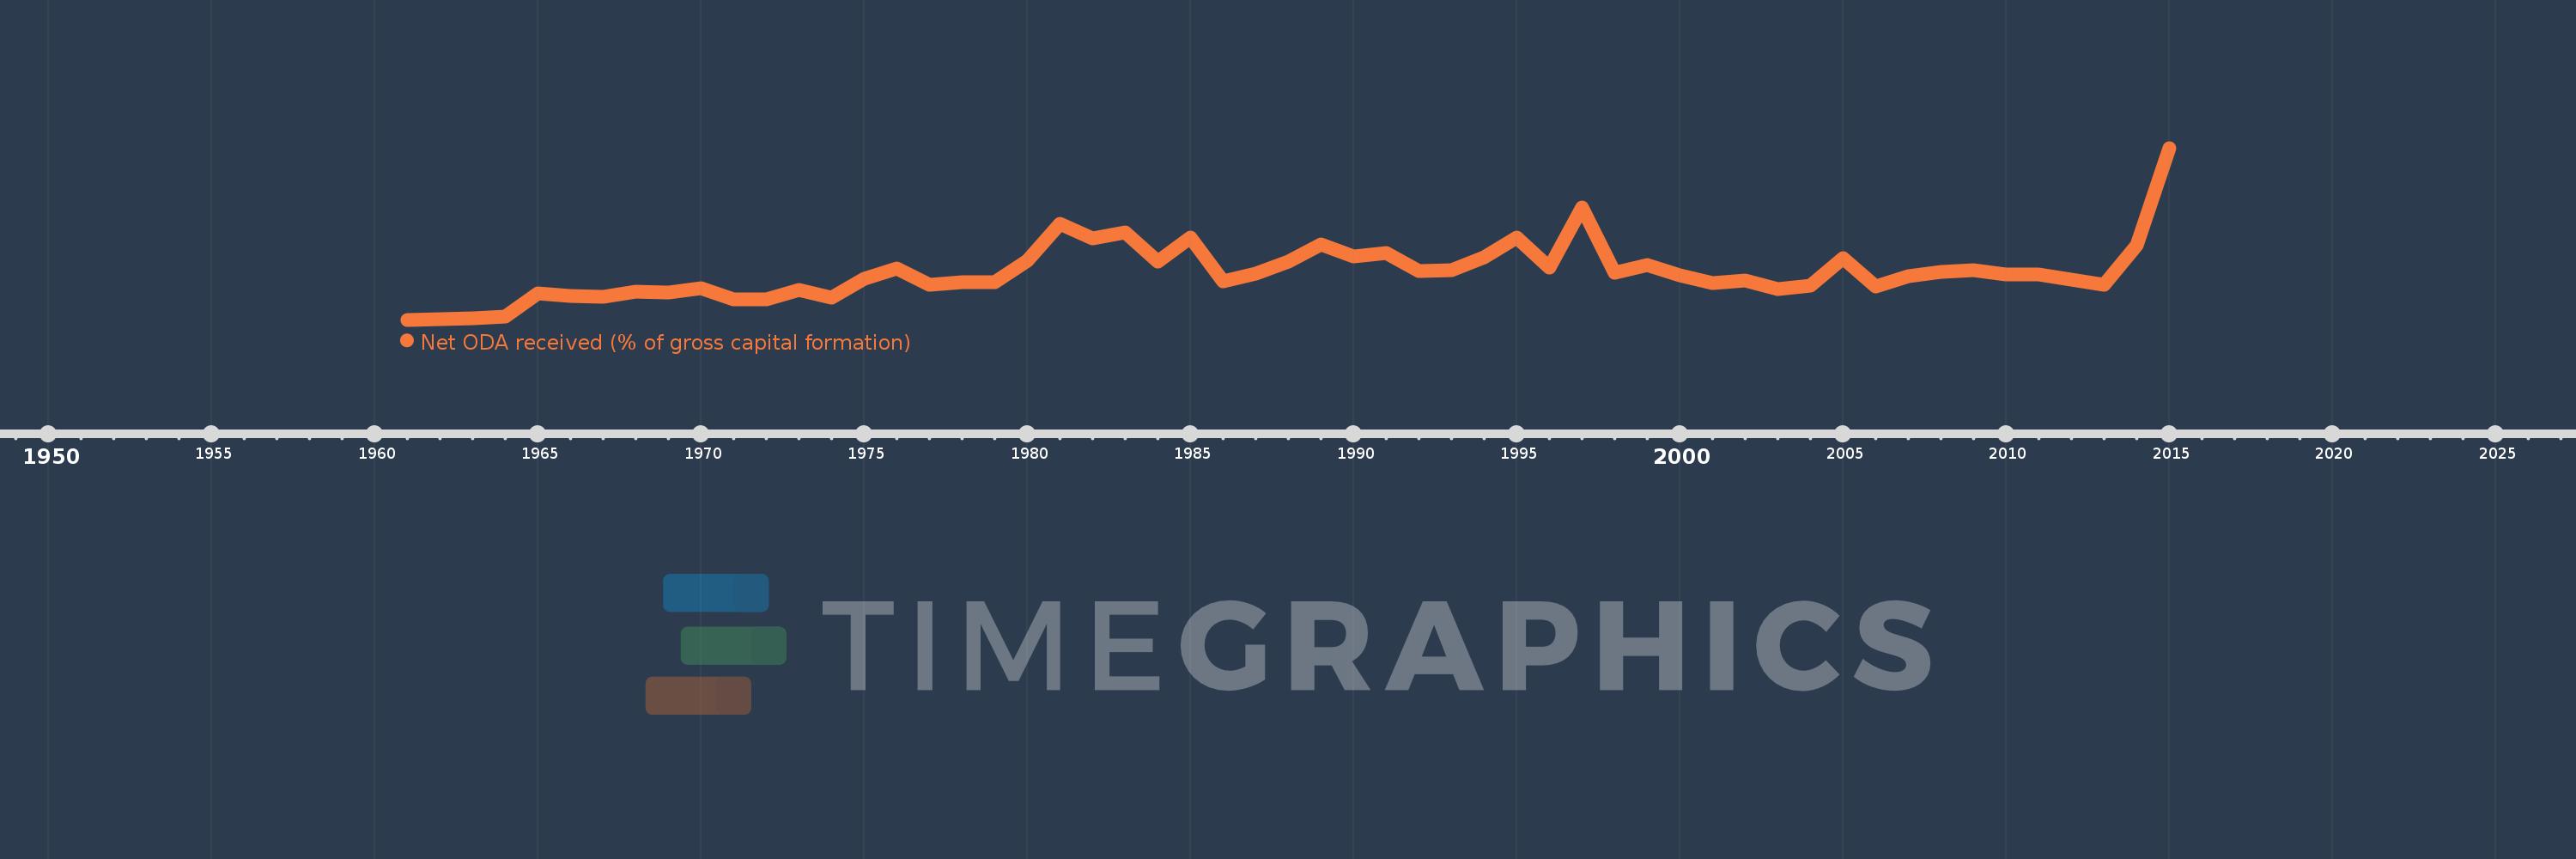
Net ODA received (% of gross capital formation)
2015,2014,2013,2012,2011,2010,2009,2008,2007,2006,2005,2004,2003,2002,2001,2000,1999,1998,1997,1996,1995,1994,1993,1992,1991,1990,1989,1988,1987,1986,1985,1984,1983,1982,1981,1980,1979,1978,1977,1976,1975,1974,1973,1972,1971,1970,1969,1968,1967,1966,1965,1964,1963,1962,1961
This statistics in other country:
AfghanistanAlbaniaAlgeriaAngolaAntigua and BarbudaArab WorldArgentinaArmeniaArubaAzerbaijanBahamas, TheBahrainBangladeshBarbadosBelarusBelizeBeninBhutanBoliviaBosnia and HerzegovinaBotswanaBrazilBrunei DarussalamBurkina FasoBurundiCabo VerdeCambodiaCameroonCaribbean small statesCentral African RepublicCentral Europe and the BalticsChadChileChinaColombiaComorosCongo, Dem. Rep.Congo, Rep.Costa RicaCote d'IvoireCroatiaCubaCyprusDjiboutiDominicaDominican RepublicEast Asia & PacificEast Asia & Pacific (excluding high income)East Asia & Pacific (IDA & IBRD countries)EcuadorEgypt, Arab Rep.El SalvadorEquatorial GuineaEritreaEthiopiaEuro areaEurope & Central AsiaEurope & Central Asia (excluding high income)Europe & Central Asia (IDA & IBRD countries)European UnionFijiFragile and conflict affected situationsGabonGambia, TheGeorgiaGhanaGrenadaGuatemalaGuineaGuinea-BissauGuyanaHaitiHeavily indebted poor countries (HIPC)High incomeHondurasHong Kong SAR, ChinaIBRD onlyIDA & IBRD totalIDA blendIDA onlyIDA totalIndiaIndonesiaIran, Islamic Rep.IraqIsraelJamaicaJordanKazakhstanKenyaKiribatiKorea, Rep.KosovoKuwaitKyrgyz RepublicLao PDRLatin America & Caribbean Latin America & Caribbean (excluding high income)Latin America & the Caribbean (IDA & IBRD countries)Least developed countries: UN classificationLebanonLesothoLiberiaLibyaLow & middle incomeLow incomeLower middle incomeMacao SAR, ChinaMacedonia, FYRMadagascarMalawiMalaysiaMaldivesMaliMaltaMauritaniaMauritiusMexicoMiddle East & North AfricaMiddle East & North Africa (excluding high income)Middle East & North Africa (IDA & IBRD countries)Middle incomeMoldovaMongoliaMontenegroMoroccoMozambiqueNamibiaNepalNew CaledoniaNicaraguaNigerNigeriaNorth AmericaOECD membersOmanOther small statesPakistanPanamaPapua New GuineaParaguayPeruPhilippinesQatarRwandaSaudi ArabiaSenegalSerbiaSeychellesSierra LeoneSingaporeSloveniaSmall statesSolomon IslandsSouth AfricaSouth AsiaSouth Asia (IDA & IBRD)South SudanSri LankaSt. Kitts and NevisSt. LuciaSt. Vincent and the GrenadinesSub-Saharan Africa Sub-Saharan Africa (excluding high income)Sub-Saharan Africa (IDA & IBRD countries)SudanSurinameSwazilandSyrian Arab RepublicTajikistanTanzaniaThailandTimor-LesteTogoTongaTrinidad and TobagoTunisiaTurkeyTurkmenistanUgandaUkraineUpper middle incomeUruguayUzbekistanVanuatuVenezuela, RBVietnamWest Bank and GazaWorldYemen, Rep.ZambiaZimbabwe Timeline:
This timeline shows a graph from 1961 to 2015 of Central African Republic. No data until 1960. Number of actual observations by date: 55.
Source name:
World Development Indicators
Source organization:
Development Assistance Committee of the Organisation for Economic Co-operation and Development, Geographical Distribution of Financial Flows to Developing Countries, Development Co-operation Report, and International Development Statistics database. Data are available online at: www.oecd.org/dac/stats/idsonline. World Bank gross capital formation estimates are used for the denominator.
Categories, topics:
Aid Effectiveness
Last updated:
apr 23, 2017
Indicators value changes by year
Maximum:
351.406
jan 1, 2015
At the date of observation
Value
Absolute change
Change from previous value
jan 1, 1961
0.136
+0.136
0.0%
jan 1, 1962
1.61
+1.473
1.08K%
jan 1, 1963
3.934
+2.325
144.42%
jan 1, 1964
7.031
+3.097
78.72%
jan 1, 1965
53.429
+46.398
659.91%
jan 1, 1966
48.95
-4.479
-8.38%
jan 1, 1967
46.919
-2.032
-4.15%
jan 1, 1968
57.503
+10.584
22.56%
jan 1, 1969
55.59
-1.913
-3.33%
jan 1, 1970
64.373
+8.783
15.8%
jan 1, 1971
42.284
-22.089
-34.31%
jan 1, 1972
41.171
-1.113
-2.63%
jan 1, 1973
60.416
+19.245
46.74%
jan 1, 1974
45.285
-15.131
-25.04%
jan 1, 1975
83.857
+38.571
85.17%
jan 1, 1976
104.765
+20.908
24.93%
jan 1, 1977
71.667
-33.098
-31.59%
jan 1, 1978
76.587
+4.921
6.87%
jan 1, 1979
76.648
+0.061
0.08%
jan 1, 1980
121.455
+44.808
58.46%
jan 1, 1981
197.17
+75.715
62.34%
jan 1, 1982
166.662
-30.508
-15.47%
jan 1, 1983
179.251
+12.589
7.55%
jan 1, 1984
118.503
-60.748
-33.89%
jan 1, 1985
167.763
+49.261
41.57%
jan 1, 1986
78.054
-89.709
-53.47%
jan 1, 1987
94.227
+16.173
20.72%
jan 1, 1988
118.663
+24.436
25.93%
jan 1, 1989
153.979
+35.316
29.76%
jan 1, 1990
130.126
-23.853
-15.49%
jan 1, 1991
135.941
+5.815
4.47%
jan 1, 1992
99.558
-36.384
-26.76%
jan 1, 1993
101.449
+1.891
1.9%
jan 1, 1994
126.956
+25.507
25.14%
jan 1, 1995
168.167
+41.212
32.46%
jan 1, 1996
106.539
-61.628
-36.65%
jan 1, 1997
230.001
+123.462
115.88%
jan 1, 1998
96.27
-133.731
-58.14%
jan 1, 1999
112.597
+16.327
16.96%
jan 1, 2000
91.153
-21.444
-19.04%
jan 1, 2001
74.346
-16.807
-18.44%
jan 1, 2002
80.05
+5.704
7.67%
jan 1, 2003
63.131
-16.919
-21.14%
jan 1, 2004
70.207
+7.075
11.21%
jan 1, 2005
126.942
+56.736
80.81%
jan 1, 2006
67.385
-59.557
-46.92%
jan 1, 2007
89.418
+22.033
32.7%
jan 1, 2008
97.518
+8.099
9.06%
jan 1, 2009
101.81
+4.292
4.4%
jan 1, 2010
92.767
-9.043
-8.88%
jan 1, 2011
92.118
-0.649
-0.7%
jan 1, 2012
81.74
-10.378
-11.27%
jan 1, 2013
70.961
-10.779
-13.19%
jan 1, 2014
153.107
+82.147
115.76%
jan 1, 2015
351.406
+198.298
129.52%
Ranking of countries by current statistics by years


Comments: