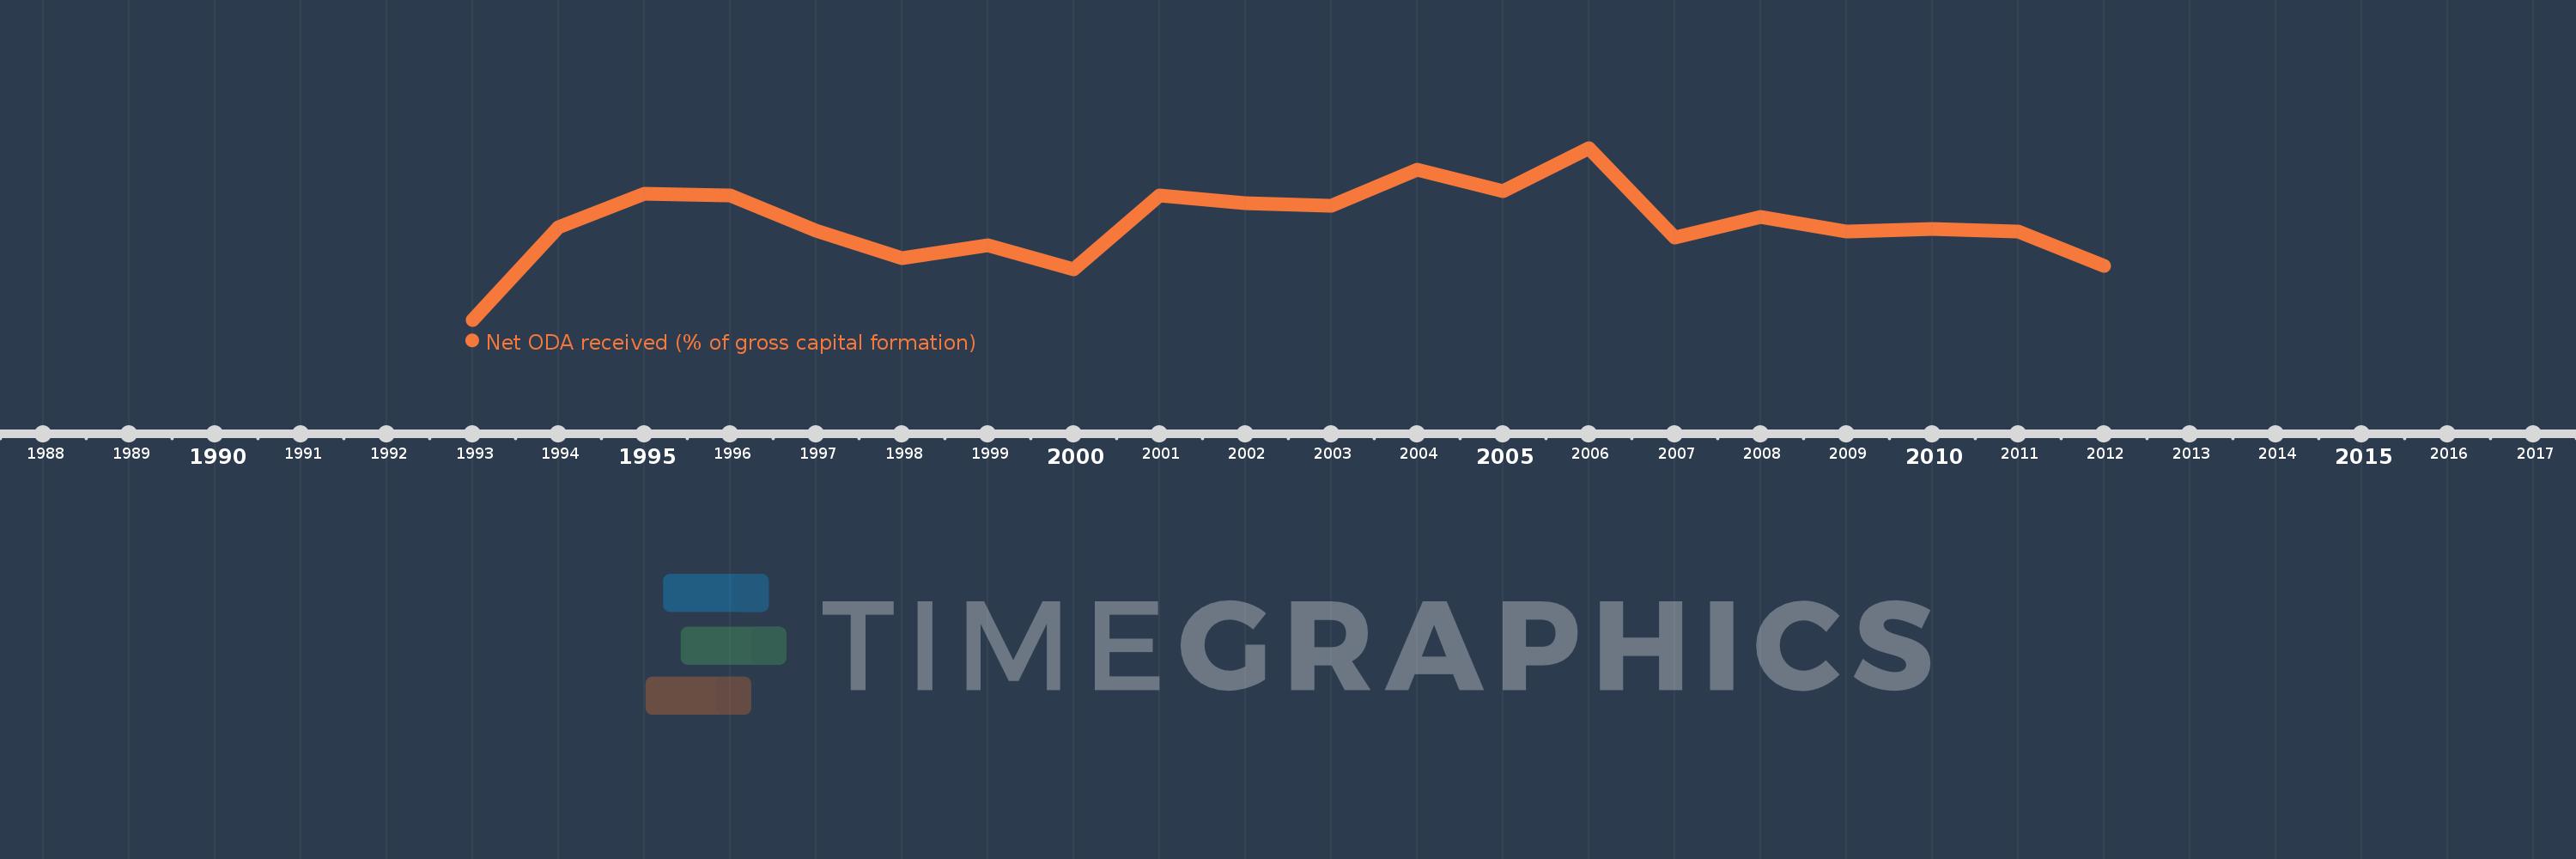
This timeline shows a graph from 1993 to 2012 of Eritrea. No data until 1992. Number of actual observations by date: 20.
Source name:
World Development Indicators
Source organization:
Development Assistance Committee of the Organisation for Economic Co-operation and Development, Geographical Distribution of Financial Flows to Developing Countries, Development Co-operation Report, and International Development Statistics database. Data are available online at: www.oecd.org/dac/stats/idsonline. World Bank gross capital formation estimates are used for the denominator.
Categories, topics:
Aid Effectiveness
Last updated:
apr 23, 2017
Indicators value changes by year
Meaning:
88.966
Minimum:
2.683
jan 1, 1993
Maximum:
156.311
jan 1, 2006
At the date of observation
Value
Absolute change
Change from the previous value
jan 1, 1993
2.683
+2.683
0.0%
jan 1, 1994
85.154
+82.47
3.07K%
jan 1, 1995
115.336
+30.183
35.44%
jan 1, 1996
113.837
-1.5
-1.3%
jan 1, 1997
82.308
-31.528
-27.7%
jan 1, 1998
57.428
-24.881
-30.23%
jan 1, 1999
69.508
+12.08
21.03%
jan 1, 2000
47.417
-22.091
-31.78%
jan 1, 2001
113.928
+66.511
140.27%
jan 1, 2002
106.94
-6.988
-6.13%
jan 1, 2003
104.772
-2.168
-2.03%
jan 1, 2004
137.218
+32.446
30.97%
jan 1, 2005
117.876
-19.341
-14.1%
jan 1, 2006
156.311
+38.434
32.61%
jan 1, 2007
75.92
-80.391
-51.43%
jan 1, 2008
94.813
+18.893
24.88%
jan 1, 2009
81.769
-13.044
-13.76%
jan 1, 2010
83.54
+1.772
2.17%
jan 1, 2011
81.572
-1.968
-2.36%
jan 1, 2012
50.995
-30.578
-37.49%
Ranking of countries by current statistics by years
