29
/
en
AIzaSyAYiBZKx7MnpbEhh9jyipgxe19OcubqV5w
April 1, 2024
186900
Malawi
MWI
true
2
1
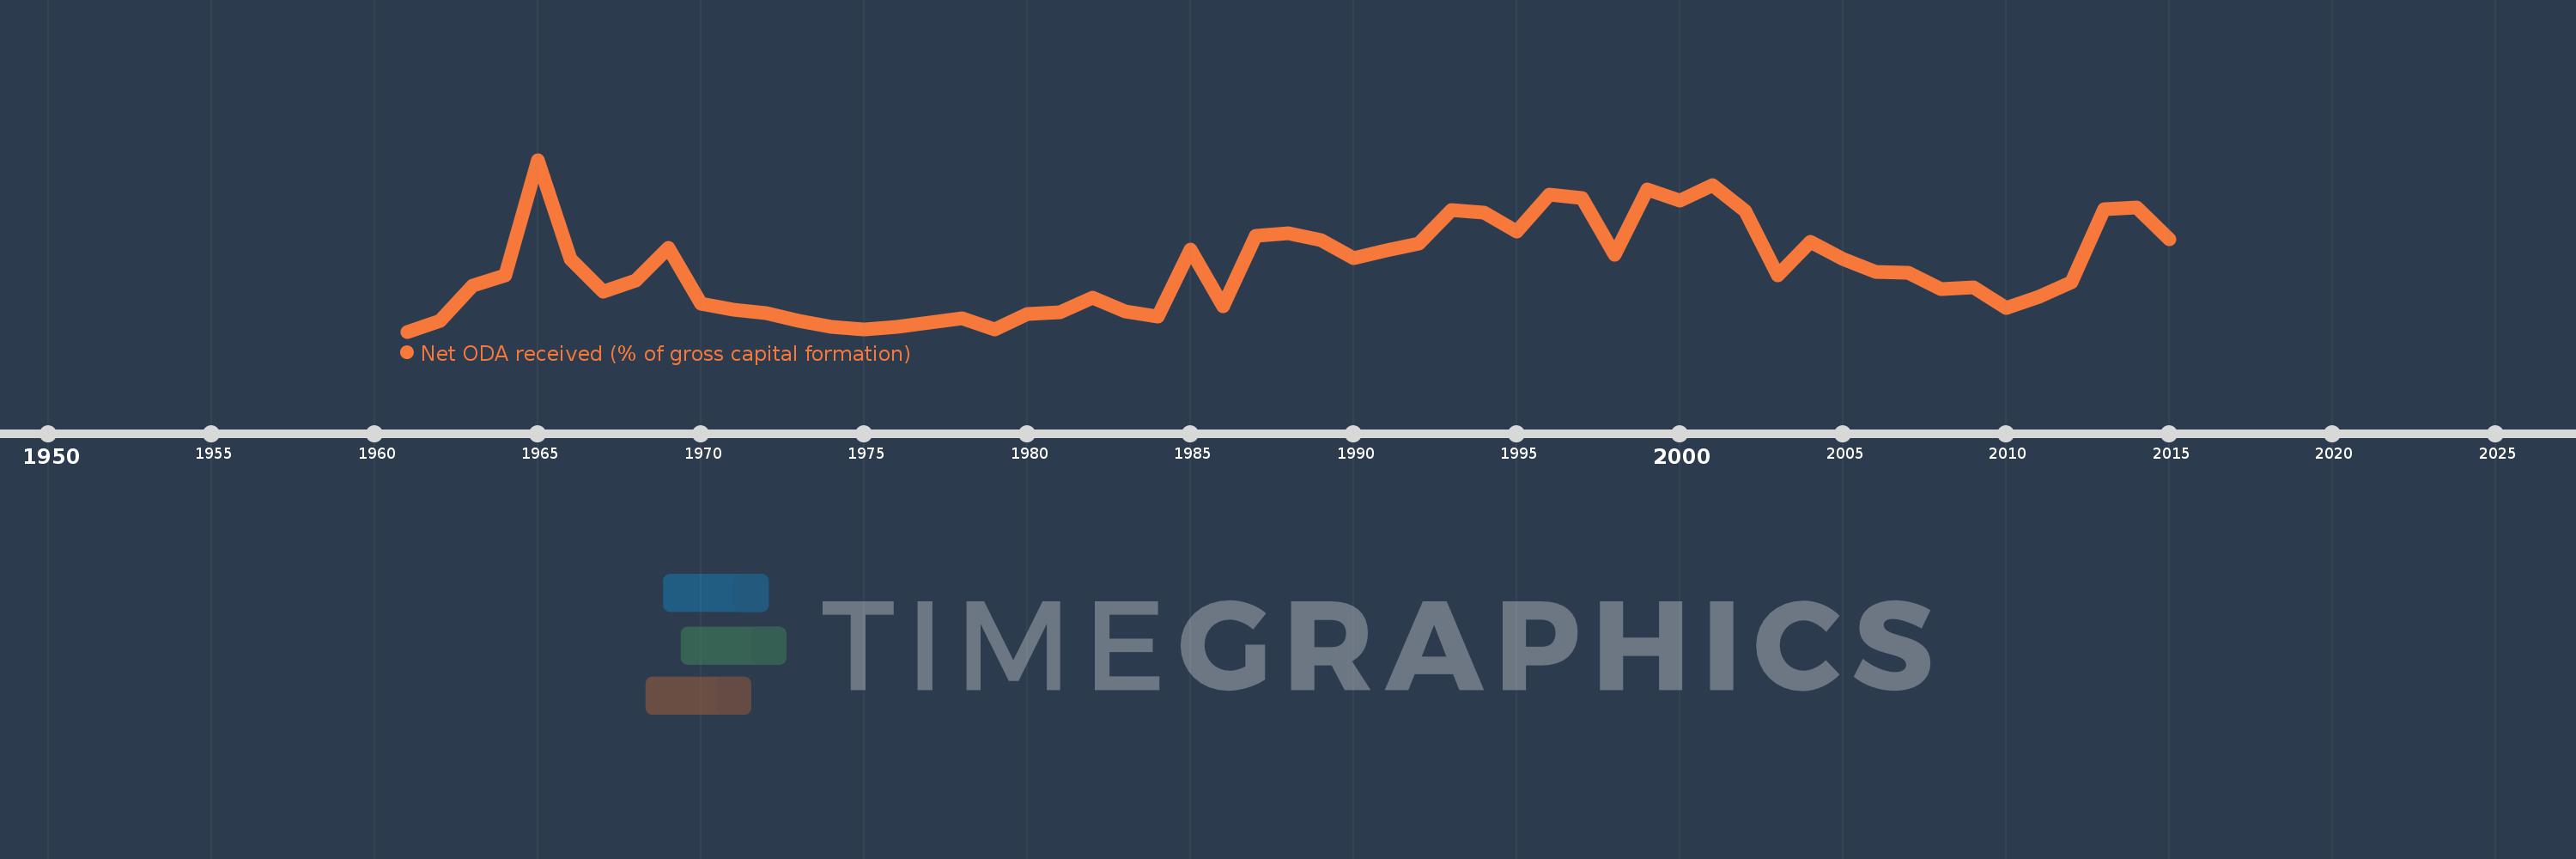
Net ODA received (% of gross capital formation)
2015,2014,2013,2012,2011,2010,2009,2008,2007,2006,2005,2004,2003,2002,2001,2000,1999,1998,1997,1996,1995,1994,1993,1992,1991,1990,1989,1988,1987,1986,1985,1984,1983,1982,1981,1980,1979,1978,1977,1976,1975,1974,1973,1972,1971,1970,1969,1968,1967,1966,1965,1964,1963,1962,1961
This statistics in other country:
AfghanistanAlbaniaAlgeriaAngolaAntigua and BarbudaArab WorldArgentinaArmeniaArubaAzerbaijanBahamas, TheBahrainBangladeshBarbadosBelarusBelizeBeninBhutanBoliviaBosnia and HerzegovinaBotswanaBrazilBrunei DarussalamBurkina FasoBurundiCabo VerdeCambodiaCameroonCaribbean small statesCentral African RepublicCentral Europe and the BalticsChadChileChinaColombiaComorosCongo, Dem. Rep.Congo, Rep.Costa RicaCote d'IvoireCroatiaCubaCyprusDjiboutiDominicaDominican RepublicEast Asia & PacificEast Asia & Pacific (excluding high income)East Asia & Pacific (IDA & IBRD countries)EcuadorEgypt, Arab Rep.El SalvadorEquatorial GuineaEritreaEthiopiaEuro areaEurope & Central AsiaEurope & Central Asia (excluding high income)Europe & Central Asia (IDA & IBRD countries)European UnionFijiFragile and conflict affected situationsGabonGambia, TheGeorgiaGhanaGrenadaGuatemalaGuineaGuinea-BissauGuyanaHaitiHeavily indebted poor countries (HIPC)High incomeHondurasHong Kong SAR, ChinaIBRD onlyIDA & IBRD totalIDA blendIDA onlyIDA totalIndiaIndonesiaIran, Islamic Rep.IraqIsraelJamaicaJordanKazakhstanKenyaKiribatiKorea, Rep.KosovoKuwaitKyrgyz RepublicLao PDRLatin America & Caribbean Latin America & Caribbean (excluding high income)Latin America & the Caribbean (IDA & IBRD countries)Least developed countries: UN classificationLebanonLesothoLiberiaLibyaLow & middle incomeLow incomeLower middle incomeMacao SAR, ChinaMacedonia, FYRMadagascarMalawiMalaysiaMaldivesMaliMaltaMauritaniaMauritiusMexicoMiddle East & North AfricaMiddle East & North Africa (excluding high income)Middle East & North Africa (IDA & IBRD countries)Middle incomeMoldovaMongoliaMontenegroMoroccoMozambiqueNamibiaNepalNew CaledoniaNicaraguaNigerNigeriaNorth AmericaOECD membersOmanOther small statesPakistanPanamaPapua New GuineaParaguayPeruPhilippinesQatarRwandaSaudi ArabiaSenegalSerbiaSeychellesSierra LeoneSingaporeSloveniaSmall statesSolomon IslandsSouth AfricaSouth AsiaSouth Asia (IDA & IBRD)South SudanSri LankaSt. Kitts and NevisSt. LuciaSt. Vincent and the GrenadinesSub-Saharan Africa Sub-Saharan Africa (excluding high income)Sub-Saharan Africa (IDA & IBRD countries)SudanSurinameSwazilandSyrian Arab RepublicTajikistanTanzaniaThailandTimor-LesteTogoTongaTrinidad and TobagoTunisiaTurkeyTurkmenistanUgandaUkraineUpper middle incomeUruguayUzbekistanVanuatuVenezuela, RBVietnamWest Bank and GazaWorldYemen, Rep.ZambiaZimbabwe Timeline:
This timeline shows a graph from 1961 to 2015 of Malawi. No data until 1960. Number of actual observations by date: 55.
Source name:
World Development Indicators
Source organization:
Development Assistance Committee of the Organisation for Economic Co-operation and Development, Geographical Distribution of Financial Flows to Developing Countries, Development Co-operation Report, and International Development Statistics database. Data are available online at: www.oecd.org/dac/stats/idsonline. World Bank gross capital formation estimates are used for the denominator.
Categories, topics:
Aid Effectiveness
Last updated:
apr 23, 2017
Indicators value changes by year
Minimum:
24.762
jan 1, 1961
Maximum:
217.356
jan 1, 1965
At the date of observation
Value
Absolute change
Change from previous value
jan 1, 1961
24.762
+24.762
0.0%
jan 1, 1962
36.972
+12.21
49.31%
jan 1, 1963
76.081
+39.109
105.78%
jan 1, 1964
87.74
+11.659
15.32%
jan 1, 1965
217.356
+129.616
147.73%
jan 1, 1966
105.77
-111.586
-51.34%
jan 1, 1967
69.907
-35.863
-33.91%
jan 1, 1968
82.406
+12.498
17.88%
jan 1, 1969
118.87
+36.464
44.25%
jan 1, 1970
56.306
-62.564
-52.63%
jan 1, 1971
49.184
-7.122
-12.65%
jan 1, 1972
45.0
-4.184
-8.51%
jan 1, 1973
36.514
-8.485
-18.86%
jan 1, 1974
29.765
-6.749
-18.48%
jan 1, 1975
27.611
-2.154
-7.24%
jan 1, 1976
30.413
+2.802
10.15%
jan 1, 1977
35.032
+4.619
15.19%
jan 1, 1978
39.649
+4.618
13.18%
jan 1, 1979
26.921
-12.728
-32.1%
jan 1, 1980
44.194
+17.272
64.16%
jan 1, 1981
46.1
+1.906
4.31%
jan 1, 1982
62.639
+16.538
35.87%
jan 1, 1983
47.601
-15.038
-24.01%
jan 1, 1984
41.414
-6.186
-13.0%
jan 1, 1985
116.541
+75.127
181.4%
jan 1, 1986
53.48
-63.061
-54.11%
jan 1, 1987
131.766
+78.286
146.38%
jan 1, 1988
135.001
+3.235
2.46%
jan 1, 1989
127.084
-7.917
-5.86%
jan 1, 1990
106.862
-20.221
-15.91%
jan 1, 1991
115.466
+8.603
8.05%
jan 1, 1992
123.249
+7.784
6.74%
jan 1, 1993
160.857
+37.607
30.51%
jan 1, 1994
157.998
-2.858
-1.78%
jan 1, 1995
136.715
-21.283
-13.47%
jan 1, 1996
178.624
+41.909
30.65%
jan 1, 1997
174.81
-3.814
-2.14%
jan 1, 1998
111.342
-63.468
-36.31%
jan 1, 1999
184.34
+72.998
65.56%
jan 1, 2000
171.663
-12.677
-6.88%
jan 1, 2001
188.629
+16.966
9.88%
jan 1, 2002
160.122
-28.507
-15.11%
jan 1, 2003
87.922
-72.199
-45.09%
jan 1, 2004
124.941
+37.019
42.1%
jan 1, 2005
105.741
-19.2
-15.37%
jan 1, 2006
91.741
-14.0
-13.24%
jan 1, 2007
90.331
-1.41
-1.54%
jan 1, 2008
72.779
-17.552
-19.43%
jan 1, 2009
74.698
+1.919
2.64%
jan 1, 2010
50.887
-23.812
-31.88%
jan 1, 2011
63.901
+13.015
25.58%
jan 1, 2012
80.29
+16.389
25.65%
jan 1, 2013
162.009
+81.719
101.78%
jan 1, 2014
163.533
+1.524
0.94%
jan 1, 2015
127.879
-35.654
-21.8%
Ranking of countries by current statistics by years


Comments: