29
/
en
AIzaSyAYiBZKx7MnpbEhh9jyipgxe19OcubqV5w
April 1, 2024
222592
Peru
PER
true
2
1
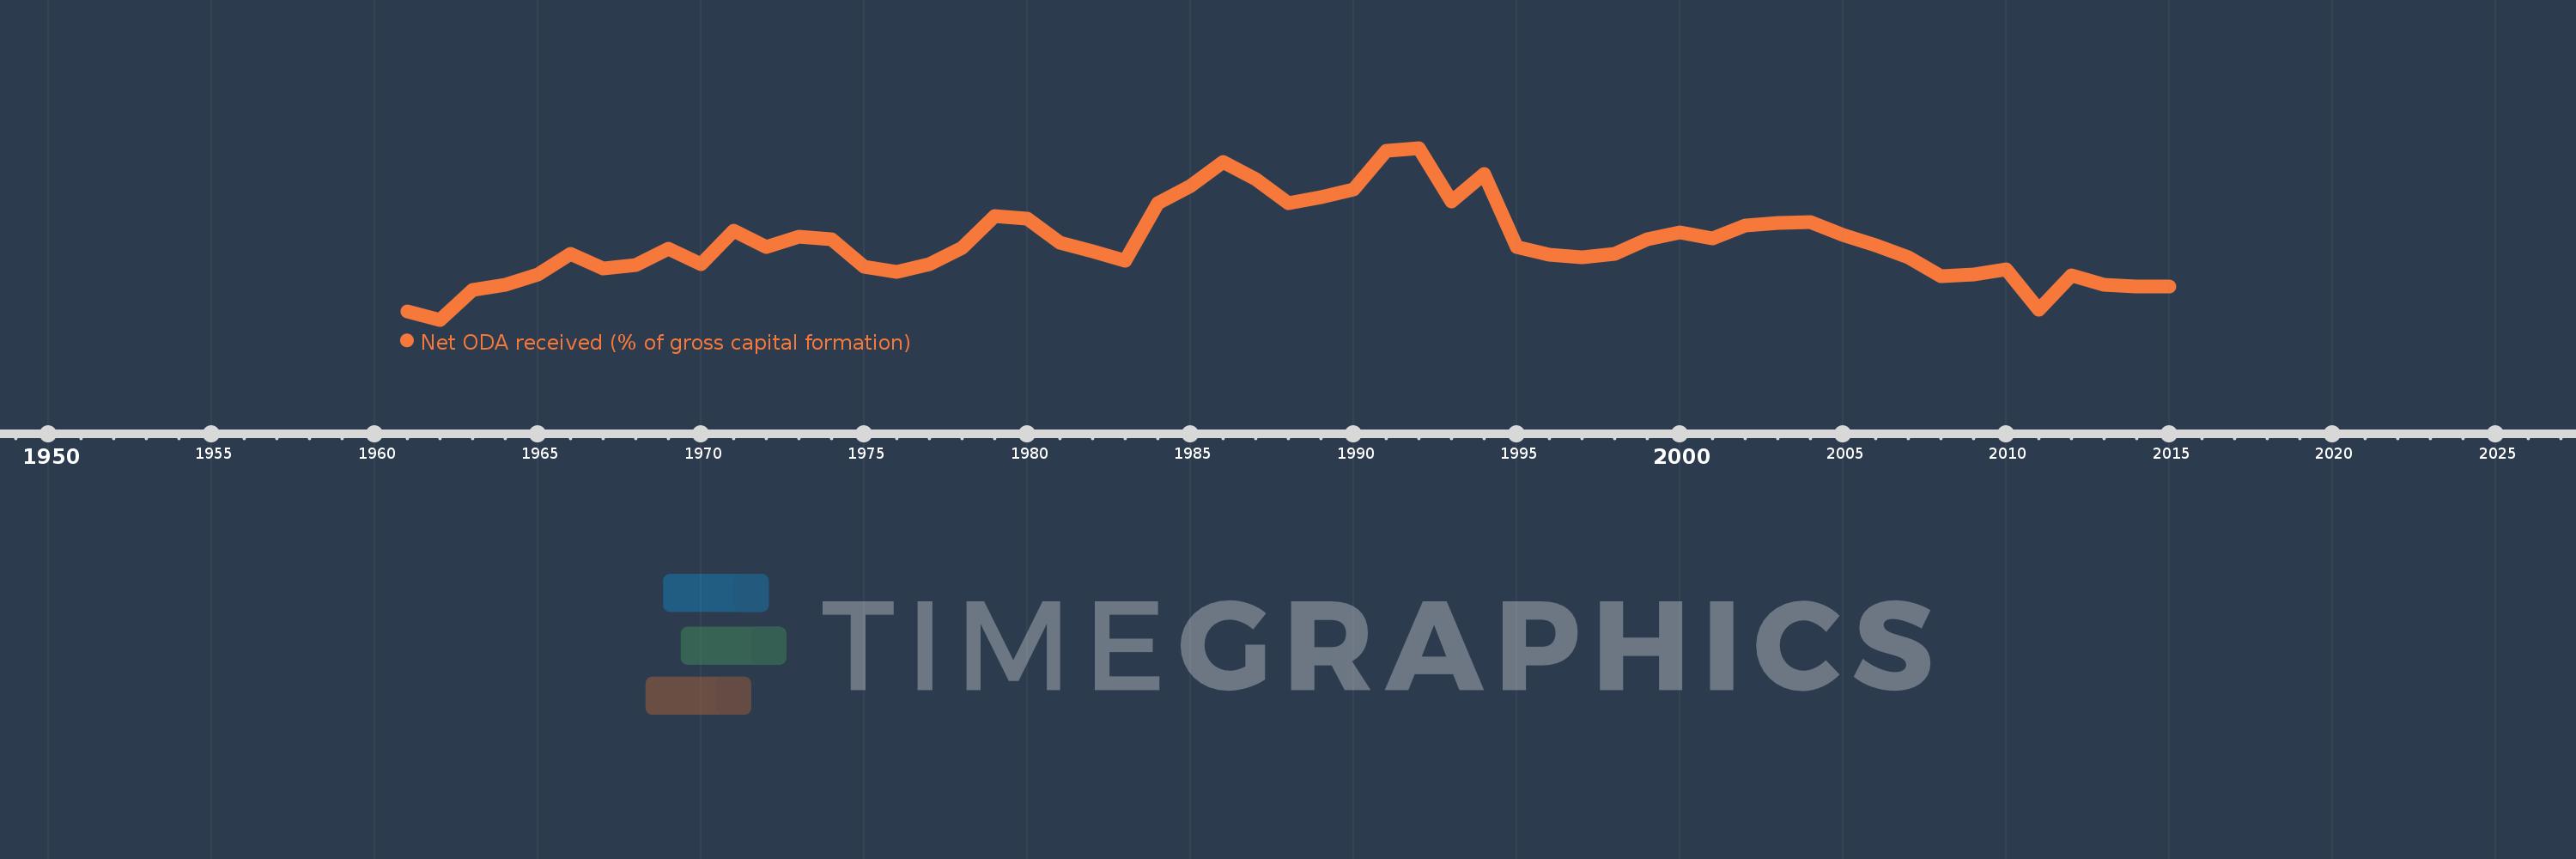
Net ODA received (% of gross capital formation)
2015,2014,2013,2012,2011,2010,2009,2008,2007,2006,2005,2004,2003,2002,2001,2000,1999,1998,1997,1996,1995,1994,1993,1992,1991,1990,1989,1988,1987,1986,1985,1984,1983,1982,1981,1980,1979,1978,1977,1976,1975,1974,1973,1972,1971,1970,1969,1968,1967,1966,1965,1964,1963,1962,1961
This statistics in other country:
AfghanistanAlbaniaAlgeriaAngolaAntigua and BarbudaArab WorldArgentinaArmeniaArubaAzerbaijanBahamas, TheBahrainBangladeshBarbadosBelarusBelizeBeninBhutanBoliviaBosnia and HerzegovinaBotswanaBrazilBrunei DarussalamBurkina FasoBurundiCabo VerdeCambodiaCameroonCaribbean small statesCentral African RepublicCentral Europe and the BalticsChadChileChinaColombiaComorosCongo, Dem. Rep.Congo, Rep.Costa RicaCote d'IvoireCroatiaCubaCyprusDjiboutiDominicaDominican RepublicEast Asia & PacificEast Asia & Pacific (excluding high income)East Asia & Pacific (IDA & IBRD countries)EcuadorEgypt, Arab Rep.El SalvadorEquatorial GuineaEritreaEthiopiaEuro areaEurope & Central AsiaEurope & Central Asia (excluding high income)Europe & Central Asia (IDA & IBRD countries)European UnionFijiFragile and conflict affected situationsGabonGambia, TheGeorgiaGhanaGrenadaGuatemalaGuineaGuinea-BissauGuyanaHaitiHeavily indebted poor countries (HIPC)High incomeHondurasHong Kong SAR, ChinaIBRD onlyIDA & IBRD totalIDA blendIDA onlyIDA totalIndiaIndonesiaIran, Islamic Rep.IraqIsraelJamaicaJordanKazakhstanKenyaKiribatiKorea, Rep.KosovoKuwaitKyrgyz RepublicLao PDRLatin America & Caribbean Latin America & Caribbean (excluding high income)Latin America & the Caribbean (IDA & IBRD countries)Least developed countries: UN classificationLebanonLesothoLiberiaLibyaLow & middle incomeLow incomeLower middle incomeMacao SAR, ChinaMacedonia, FYRMadagascarMalawiMalaysiaMaldivesMaliMaltaMauritaniaMauritiusMexicoMiddle East & North AfricaMiddle East & North Africa (excluding high income)Middle East & North Africa (IDA & IBRD countries)Middle incomeMoldovaMongoliaMontenegroMoroccoMozambiqueNamibiaNepalNew CaledoniaNicaraguaNigerNigeriaNorth AmericaOECD membersOmanOther small statesPakistanPanamaPapua New GuineaParaguayPeruPhilippinesQatarRwandaSaudi ArabiaSenegalSerbiaSeychellesSierra LeoneSingaporeSloveniaSmall statesSolomon IslandsSouth AfricaSouth AsiaSouth Asia (IDA & IBRD)South SudanSri LankaSt. Kitts and NevisSt. LuciaSt. Vincent and the GrenadinesSub-Saharan Africa Sub-Saharan Africa (excluding high income)Sub-Saharan Africa (IDA & IBRD countries)SudanSurinameSwazilandSyrian Arab RepublicTajikistanTanzaniaThailandTimor-LesteTogoTongaTrinidad and TobagoTunisiaTurkeyTurkmenistanUgandaUkraineUpper middle incomeUruguayUzbekistanVanuatuVenezuela, RBVietnamWest Bank and GazaWorldYemen, Rep.ZambiaZimbabwe Timeline:
This timeline shows a graph from 1961 to 2015 of Peru. No data until 1960. Number of actual observations by date: 55.
Source name:
World Development Indicators
Source organization:
Development Assistance Committee of the Organisation for Economic Co-operation and Development, Geographical Distribution of Financial Flows to Developing Countries, Development Co-operation Report, and International Development Statistics database. Data are available online at: www.oecd.org/dac/stats/idsonline. World Bank gross capital formation estimates are used for the denominator.
Categories, topics:
Aid Effectiveness
Last updated:
apr 23, 2017
Indicators value changes by year
Minimum:
-1.556
jan 1, 1962
At the date of observation
Value
Absolute change
Change from previous value
jan 1, 1961
-0.996
-0.996
0.0%
jan 1, 1962
-1.556
-0.561
56.33%
jan 1, 1963
0.418
+1.974
-126.83%
jan 1, 1964
0.808
+0.39
93.45%
jan 1, 1965
1.513
+0.705
87.31%
jan 1, 1966
2.87
+1.357
89.65%
jan 1, 1967
1.861
-1.009
-35.17%
jan 1, 1968
2.11
+0.249
13.4%
jan 1, 1969
3.218
+1.108
52.51%
jan 1, 1970
2.193
-1.026
-31.87%
jan 1, 1971
4.437
+2.244
102.35%
jan 1, 1972
3.318
-1.119
-25.22%
jan 1, 1973
4.039
+0.721
21.74%
jan 1, 1974
3.838
-0.201
-4.98%
jan 1, 1975
2.031
-1.807
-47.08%
jan 1, 1976
1.664
-0.367
-18.09%
jan 1, 1977
2.159
+0.495
29.78%
jan 1, 1978
3.255
+1.096
50.76%
jan 1, 1979
5.381
+2.126
65.31%
jan 1, 1980
5.264
-0.117
-2.18%
jan 1, 1981
3.648
-1.616
-30.69%
jan 1, 1982
3.04
-0.608
-16.67%
jan 1, 1983
2.398
-0.642
-21.12%
jan 1, 1984
6.291
+3.893
162.35%
jan 1, 1985
7.443
+1.152
18.32%
jan 1, 1986
9.018
+1.575
21.16%
jan 1, 1987
7.869
-1.149
-12.74%
jan 1, 1988
6.267
-1.603
-20.37%
jan 1, 1989
6.694
+0.428
6.82%
jan 1, 1990
7.221
+0.526
7.86%
jan 1, 1991
9.801
+2.58
35.73%
jan 1, 1992
9.984
+0.184
1.87%
jan 1, 1993
6.367
-3.618
-36.23%
jan 1, 1994
8.227
+1.86
29.21%
jan 1, 1995
3.342
-4.885
-59.38%
jan 1, 1996
2.812
-0.529
-15.84%
jan 1, 1997
2.626
-0.186
-6.63%
jan 1, 1998
2.842
+0.216
8.23%
jan 1, 1999
3.866
+1.023
36.01%
jan 1, 2000
4.289
+0.423
10.94%
jan 1, 2001
3.907
-0.381
-8.89%
jan 1, 2002
4.769
+0.862
22.07%
jan 1, 2003
4.963
+0.193
4.06%
jan 1, 2004
5.026
+0.063
1.27%
jan 1, 2005
4.118
-0.908
-18.07%
jan 1, 2006
3.427
-0.691
-16.79%
jan 1, 2007
2.661
-0.766
-22.36%
jan 1, 2008
1.364
-1.297
-48.74%
jan 1, 2009
1.467
+0.103
7.57%
jan 1, 2010
1.828
+0.36
24.57%
jan 1, 2011
-0.855
-2.682
-146.77%
jan 1, 2012
1.441
+2.296
-268.63%
jan 1, 2013
0.813
-0.628
-43.59%
jan 1, 2014
0.7
-0.113
-13.95%
jan 1, 2015
0.655
-0.044
-6.32%
Ranking of countries by current statistics by years


Comments: