29
/
en
AIzaSyAYiBZKx7MnpbEhh9jyipgxe19OcubqV5w
April 1, 2024
27550
East Asia & Pacific
EAS
false
2
1
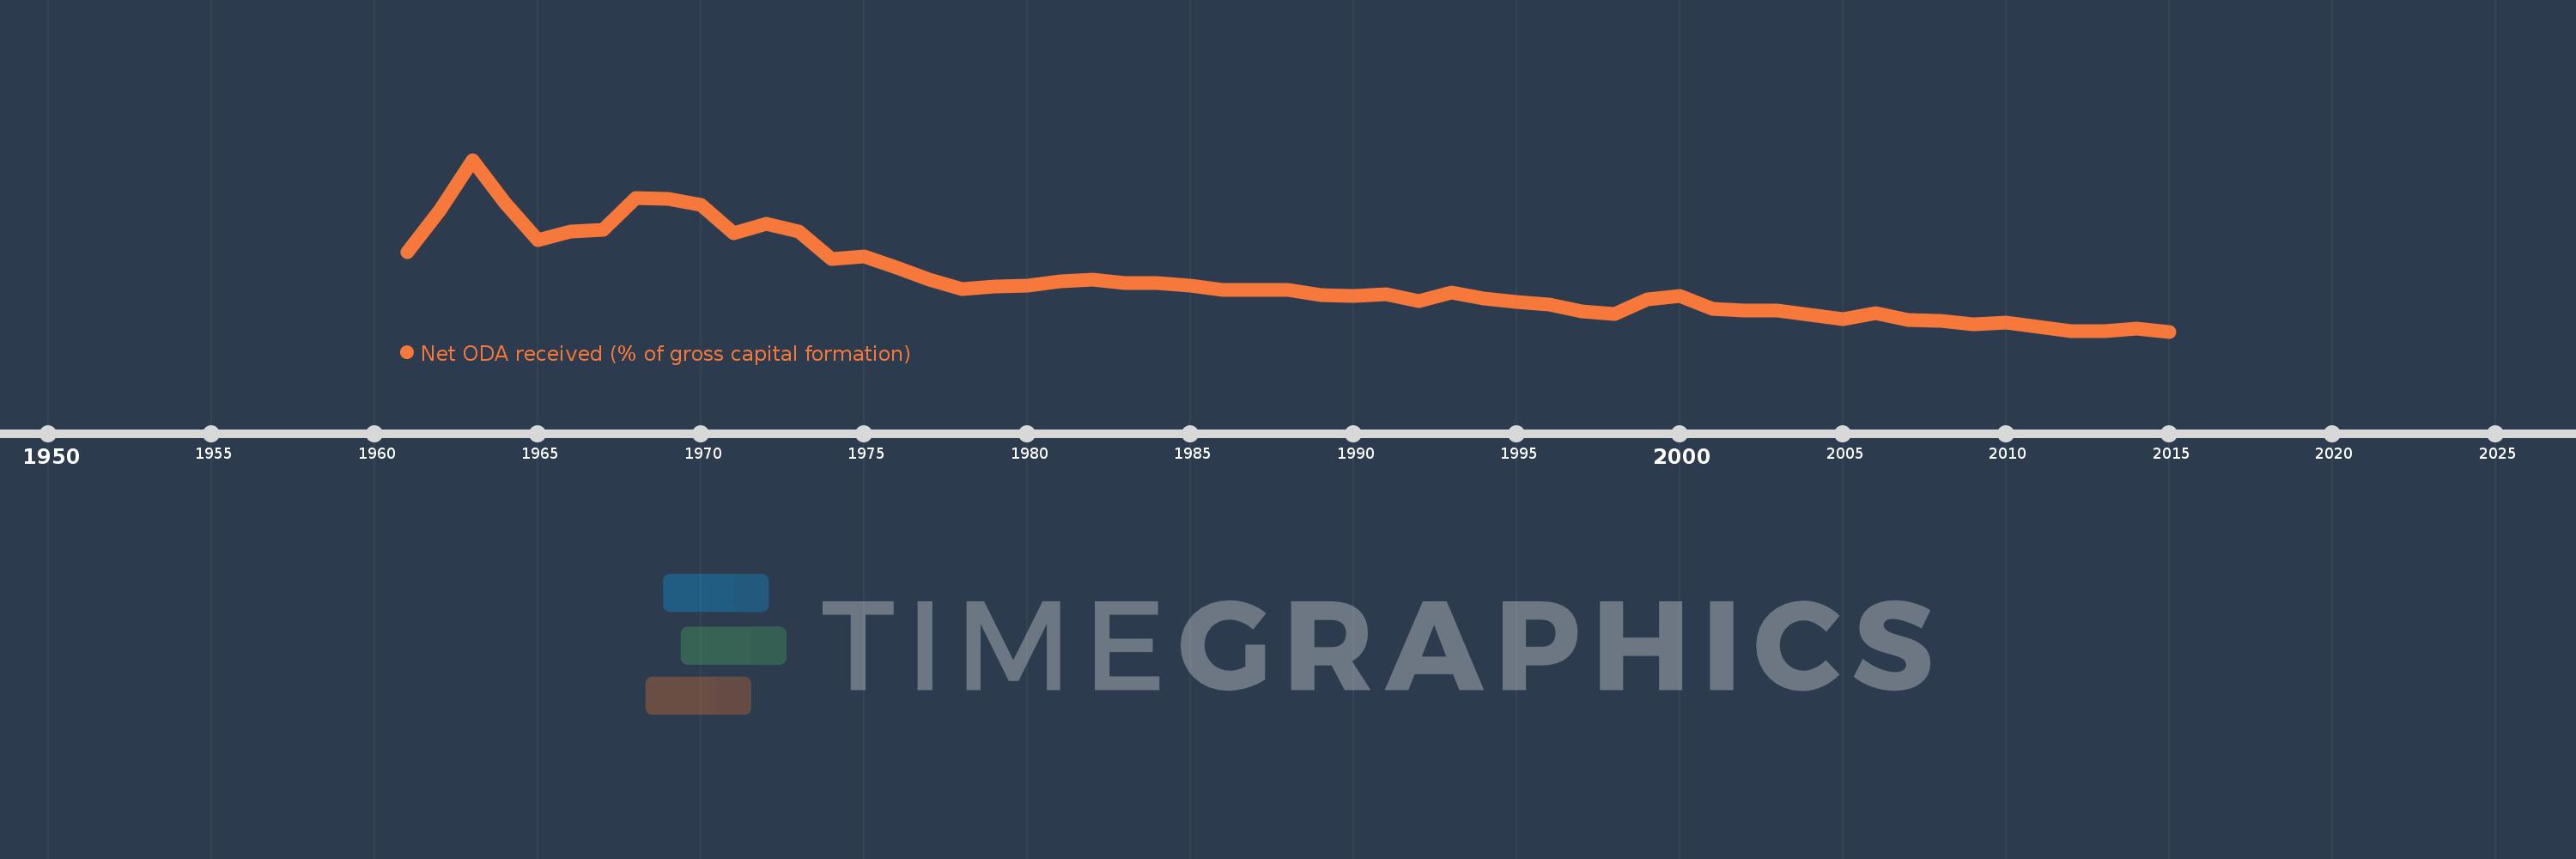
Net ODA received (% of gross capital formation)
2015,2014,2013,2012,2011,2010,2009,2008,2007,2006,2005,2004,2003,2002,2001,2000,1999,1998,1997,1996,1995,1994,1993,1992,1991,1990,1989,1988,1987,1986,1985,1984,1983,1982,1981,1980,1979,1978,1977,1976,1975,1974,1973,1972,1971,1970,1969,1968,1967,1966,1965,1964,1963,1962,1961
This statistics in other country:
AfghanistanAlbaniaAlgeriaAngolaAntigua and BarbudaArab WorldArgentinaArmeniaArubaAzerbaijanBahamas, TheBahrainBangladeshBarbadosBelarusBelizeBeninBhutanBoliviaBosnia and HerzegovinaBotswanaBrazilBrunei DarussalamBurkina FasoBurundiCabo VerdeCambodiaCameroonCaribbean small statesCentral African RepublicCentral Europe and the BalticsChadChileChinaColombiaComorosCongo, Dem. Rep.Congo, Rep.Costa RicaCote d'IvoireCroatiaCubaCyprusDjiboutiDominicaDominican RepublicEast Asia & PacificEast Asia & Pacific (excluding high income)East Asia & Pacific (IDA & IBRD countries)EcuadorEgypt, Arab Rep.El SalvadorEquatorial GuineaEritreaEthiopiaEuro areaEurope & Central AsiaEurope & Central Asia (excluding high income)Europe & Central Asia (IDA & IBRD countries)European UnionFijiFragile and conflict affected situationsGabonGambia, TheGeorgiaGhanaGrenadaGuatemalaGuineaGuinea-BissauGuyanaHaitiHeavily indebted poor countries (HIPC)High incomeHondurasHong Kong SAR, ChinaIBRD onlyIDA & IBRD totalIDA blendIDA onlyIDA totalIndiaIndonesiaIran, Islamic Rep.IraqIsraelJamaicaJordanKazakhstanKenyaKiribatiKorea, Rep.KosovoKuwaitKyrgyz RepublicLao PDRLatin America & Caribbean Latin America & Caribbean (excluding high income)Latin America & the Caribbean (IDA & IBRD countries)Least developed countries: UN classificationLebanonLesothoLiberiaLibyaLow & middle incomeLow incomeLower middle incomeMacao SAR, ChinaMacedonia, FYRMadagascarMalawiMalaysiaMaldivesMaliMaltaMauritaniaMauritiusMexicoMiddle East & North AfricaMiddle East & North Africa (excluding high income)Middle East & North Africa (IDA & IBRD countries)Middle incomeMoldovaMongoliaMontenegroMoroccoMozambiqueNamibiaNepalNew CaledoniaNicaraguaNigerNigeriaNorth AmericaOECD membersOmanOther small statesPakistanPanamaPapua New GuineaParaguayPeruPhilippinesQatarRwandaSaudi ArabiaSenegalSerbiaSeychellesSierra LeoneSingaporeSloveniaSmall statesSolomon IslandsSouth AfricaSouth AsiaSouth Asia (IDA & IBRD)South SudanSri LankaSt. Kitts and NevisSt. LuciaSt. Vincent and the GrenadinesSub-Saharan Africa Sub-Saharan Africa (excluding high income)Sub-Saharan Africa (IDA & IBRD countries)SudanSurinameSwazilandSyrian Arab RepublicTajikistanTanzaniaThailandTimor-LesteTogoTongaTrinidad and TobagoTunisiaTurkeyTurkmenistanUgandaUkraineUpper middle incomeUruguayUzbekistanVanuatuVenezuela, RBVietnamWest Bank and GazaWorldYemen, Rep.ZambiaZimbabwe Timeline:
This timeline shows a graph from 1961 to 2015 of East Asia & Pacific. No data until 1960. Number of actual observations by date: 55.
Source name:
World Development Indicators
Source organization:
Development Assistance Committee of the Organisation for Economic Co-operation and Development, Geographical Distribution of Financial Flows to Developing Countries, Development Co-operation Report, and International Development Statistics database. Data are available online at: www.oecd.org/dac/stats/idsonline. World Bank gross capital formation estimates are used for the denominator.
Categories, topics:
Aid Effectiveness
Last updated:
apr 23, 2017
Indicators value changes by year
At the date of observation
Value
Absolute change
Change from previous value
jan 1, 1961
1.048
+1.048
0.0%
jan 1, 1962
1.534
+0.485
46.28%
jan 1, 1963
2.115
+0.582
37.92%
jan 1, 1964
1.609
-0.506
-23.94%
jan 1, 1965
1.186
-0.423
-26.29%
jan 1, 1966
1.278
+0.092
7.78%
jan 1, 1967
1.3
+0.022
1.74%
jan 1, 1968
1.669
+0.369
28.39%
jan 1, 1969
1.664
-0.005
-0.3%
jan 1, 1970
1.59
-0.074
-4.46%
jan 1, 1971
1.263
-0.328
-20.6%
jan 1, 1972
1.376
+0.113
8.97%
jan 1, 1973
1.28
-0.096
-6.96%
jan 1, 1974
0.968
-0.312
-24.39%
jan 1, 1975
0.994
+0.026
2.66%
jan 1, 1976
0.867
-0.126
-12.71%
jan 1, 1977
0.721
-0.146
-16.87%
jan 1, 1978
0.62
-0.101
-13.97%
jan 1, 1979
0.644
+0.024
3.82%
jan 1, 1980
0.656
+0.013
1.96%
jan 1, 1981
0.701
+0.044
6.71%
jan 1, 1982
0.726
+0.025
3.62%
jan 1, 1983
0.688
-0.037
-5.16%
jan 1, 1984
0.689
+0.0
0.01%
jan 1, 1985
0.656
-0.032
-4.71%
jan 1, 1986
0.61
-0.046
-6.99%
jan 1, 1987
0.602
-0.008
-1.28%
jan 1, 1988
0.609
+0.007
1.15%
jan 1, 1989
0.549
-0.06
-9.9%
jan 1, 1990
0.536
-0.013
-2.41%
jan 1, 1991
0.556
+0.02
3.72%
jan 1, 1992
0.474
-0.082
-14.71%
jan 1, 1993
0.575
+0.101
21.41%
jan 1, 1994
0.503
-0.072
-12.54%
jan 1, 1995
0.467
-0.036
-7.12%
jan 1, 1996
0.436
-0.031
-6.65%
jan 1, 1997
0.359
-0.077
-17.71%
jan 1, 1998
0.33
-0.029
-8.17%
jan 1, 1999
0.492
+0.162
49.07%
jan 1, 2000
0.531
+0.04
8.07%
jan 1, 2001
0.387
-0.144
-27.12%
jan 1, 2002
0.367
-0.02
-5.16%
jan 1, 2003
0.366
-0.001
-0.26%
jan 1, 2004
0.314
-0.052
-14.19%
jan 1, 2005
0.265
-0.049
-15.73%
jan 1, 2006
0.338
+0.073
27.72%
jan 1, 2007
0.253
-0.085
-25.25%
jan 1, 2008
0.244
-0.009
-3.54%
jan 1, 2009
0.208
-0.036
-14.63%
jan 1, 2010
0.228
+0.02
9.73%
jan 1, 2011
0.178
-0.05
-21.94%
jan 1, 2012
0.123
-0.056
-31.24%
jan 1, 2013
0.125
+0.002
1.62%
jan 1, 2014
0.161
+0.036
29.28%
jan 1, 2015
0.122
-0.039
-24.41%
Ranking of countries by current statistics by years


Comments: