29
/
en
AIzaSyAYiBZKx7MnpbEhh9jyipgxe19OcubqV5w
April 1, 2024
160821
Israel
ISR
true
2
1
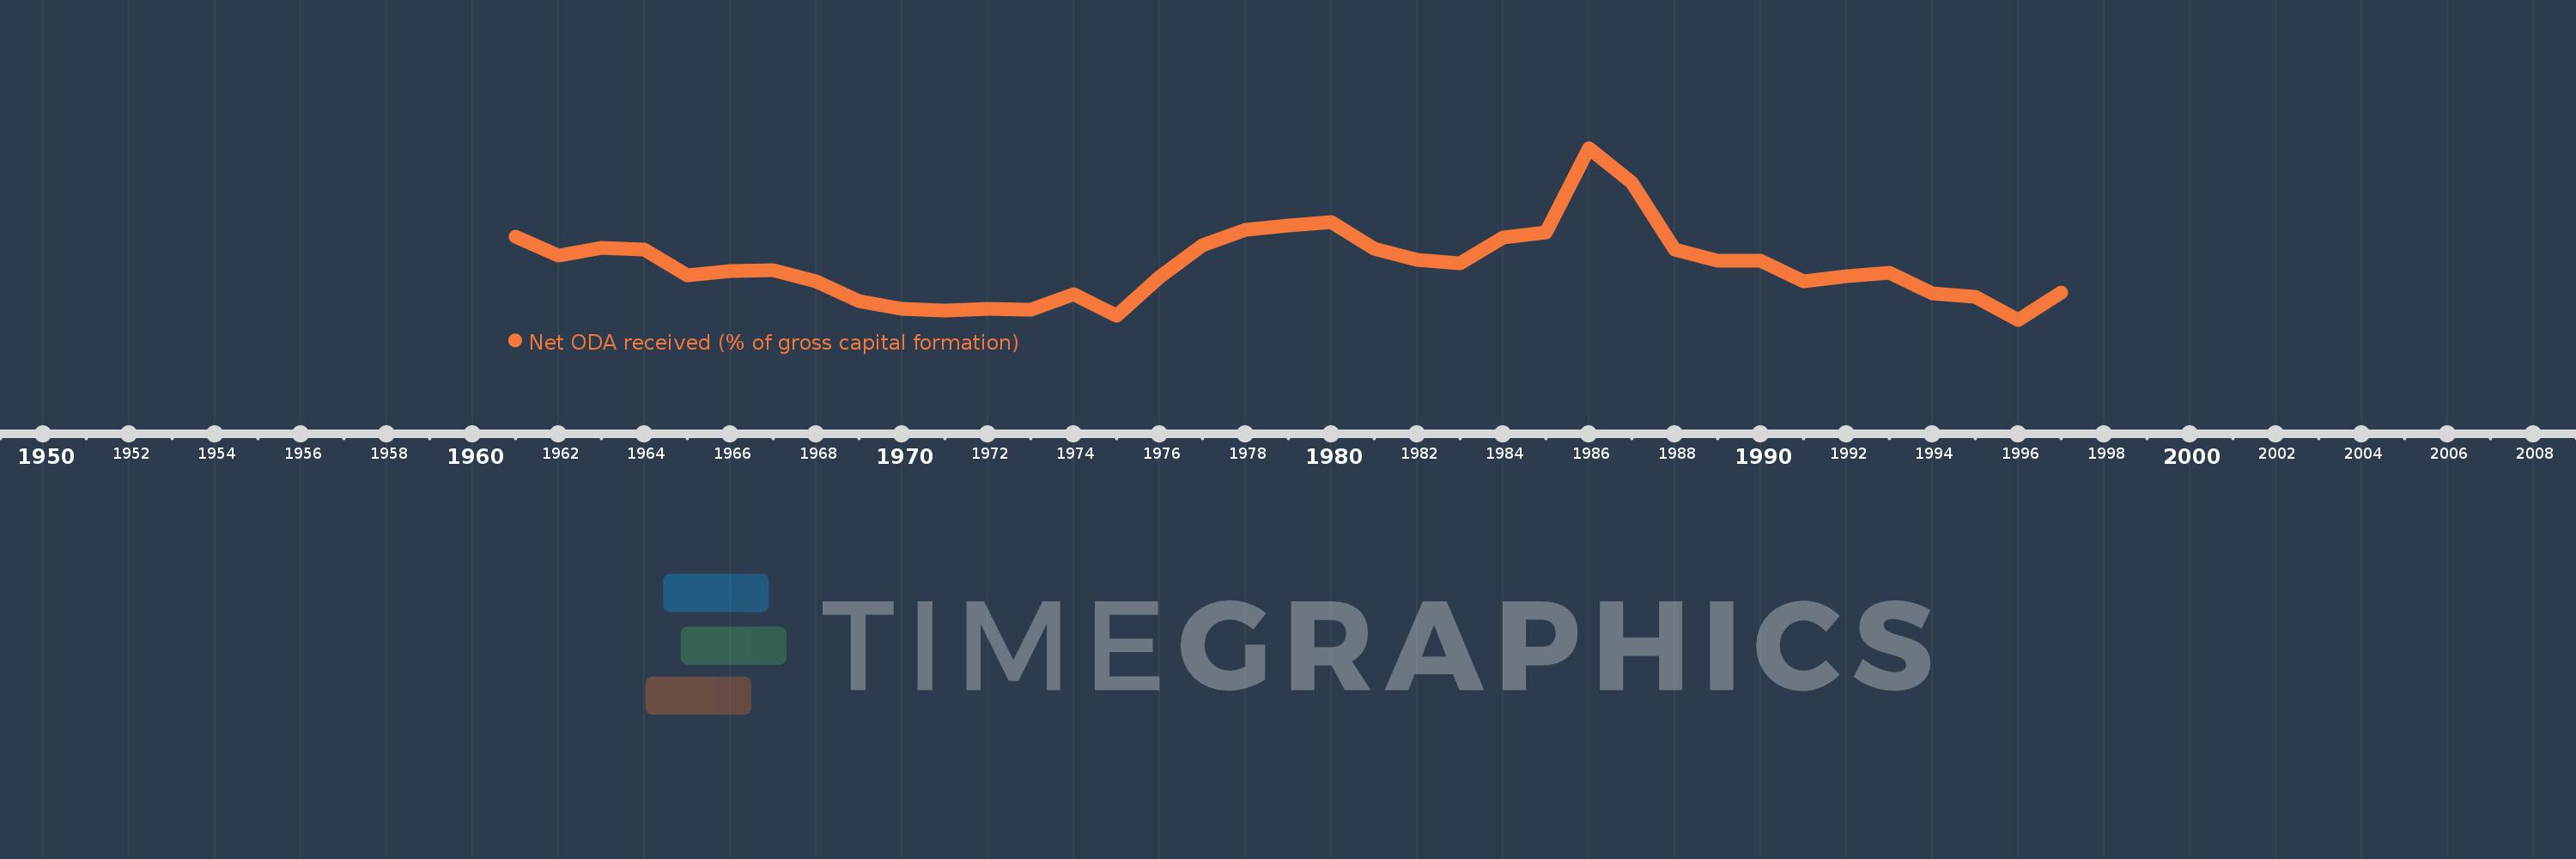
Net ODA received (% of gross capital formation)
1997,1996,1995,1994,1993,1992,1991,1990,1989,1988,1987,1986,1985,1984,1983,1982,1981,1980,1979,1978,1977,1976,1975,1974,1973,1972,1971,1970,1969,1968,1967,1966,1965,1964,1963,1962,1961
This statistics in other country:
AfghanistanAlbaniaAlgeriaAngolaAntigua and BarbudaArab WorldArgentinaArmeniaArubaAzerbaijanBahamas, TheBahrainBangladeshBarbadosBelarusBelizeBeninBhutanBoliviaBosnia and HerzegovinaBotswanaBrazilBrunei DarussalamBurkina FasoBurundiCabo VerdeCambodiaCameroonCaribbean small statesCentral African RepublicCentral Europe and the BalticsChadChileChinaColombiaComorosCongo, Dem. Rep.Congo, Rep.Costa RicaCote d'IvoireCroatiaCubaCyprusDjiboutiDominicaDominican RepublicEast Asia & PacificEast Asia & Pacific (excluding high income)East Asia & Pacific (IDA & IBRD countries)EcuadorEgypt, Arab Rep.El SalvadorEquatorial GuineaEritreaEthiopiaEuro areaEurope & Central AsiaEurope & Central Asia (excluding high income)Europe & Central Asia (IDA & IBRD countries)European UnionFijiFragile and conflict affected situationsGabonGambia, TheGeorgiaGhanaGrenadaGuatemalaGuineaGuinea-BissauGuyanaHaitiHeavily indebted poor countries (HIPC)High incomeHondurasHong Kong SAR, ChinaIBRD onlyIDA & IBRD totalIDA blendIDA onlyIDA totalIndiaIndonesiaIran, Islamic Rep.IraqIsraelJamaicaJordanKazakhstanKenyaKiribatiKorea, Rep.KosovoKuwaitKyrgyz RepublicLao PDRLatin America & Caribbean Latin America & Caribbean (excluding high income)Latin America & the Caribbean (IDA & IBRD countries)Least developed countries: UN classificationLebanonLesothoLiberiaLibyaLow & middle incomeLow incomeLower middle incomeMacao SAR, ChinaMacedonia, FYRMadagascarMalawiMalaysiaMaldivesMaliMaltaMauritaniaMauritiusMexicoMiddle East & North AfricaMiddle East & North Africa (excluding high income)Middle East & North Africa (IDA & IBRD countries)Middle incomeMoldovaMongoliaMontenegroMoroccoMozambiqueNamibiaNepalNew CaledoniaNicaraguaNigerNigeriaNorth AmericaOECD membersOmanOther small statesPakistanPanamaPapua New GuineaParaguayPeruPhilippinesQatarRwandaSaudi ArabiaSenegalSerbiaSeychellesSierra LeoneSingaporeSloveniaSmall statesSolomon IslandsSouth AfricaSouth AsiaSouth Asia (IDA & IBRD)South SudanSri LankaSt. Kitts and NevisSt. LuciaSt. Vincent and the GrenadinesSub-Saharan Africa Sub-Saharan Africa (excluding high income)Sub-Saharan Africa (IDA & IBRD countries)SudanSurinameSwazilandSyrian Arab RepublicTajikistanTanzaniaThailandTimor-LesteTogoTongaTrinidad and TobagoTunisiaTurkeyTurkmenistanUgandaUkraineUpper middle incomeUruguayUzbekistanVanuatuVenezuela, RBVietnamWest Bank and GazaWorldYemen, Rep.ZambiaZimbabwe Timeline:
This timeline shows a graph from 1961 to 1997 of Israel. No data until 1960. Number of actual observations by date: 37.
Source name:
World Development Indicators
Source organization:
Development Assistance Committee of the Organisation for Economic Co-operation and Development, Geographical Distribution of Financial Flows to Developing Countries, Development Co-operation Report, and International Development Statistics database. Data are available online at: www.oecd.org/dac/stats/idsonline. World Bank gross capital formation estimates are used for the denominator.
Categories, topics:
Aid Effectiveness
Last updated:
apr 23, 2017
Indicators value changes by year
Maximum:
42.368
jan 1, 1986
At the date of observation
Value
Absolute change
Change from previous value
jan 1, 1961
21.2
+21.2
0.0%
jan 1, 1962
16.708
-4.492
-21.19%
jan 1, 1963
18.58
+1.872
11.2%
jan 1, 1964
18.029
-0.551
-2.97%
jan 1, 1965
11.985
-6.044
-33.52%
jan 1, 1966
12.871
+0.886
7.39%
jan 1, 1967
13.242
+0.371
2.88%
jan 1, 1968
10.398
-2.844
-21.48%
jan 1, 1969
5.772
-4.626
-44.49%
jan 1, 1970
3.892
-1.88
-32.57%
jan 1, 1971
3.545
-0.347
-8.92%
jan 1, 1972
3.861
+0.316
8.91%
jan 1, 1973
3.64
-0.221
-5.72%
jan 1, 1974
7.442
+3.801
104.43%
jan 1, 1975
2.352
-5.09
-68.4%
jan 1, 1976
11.477
+9.125
387.99%
jan 1, 1977
19.076
+7.599
66.22%
jan 1, 1978
22.705
+3.629
19.02%
jan 1, 1979
23.812
+1.107
4.88%
jan 1, 1980
24.566
+0.754
3.17%
jan 1, 1981
18.2
-6.366
-25.91%
jan 1, 1982
15.724
-2.476
-13.6%
jan 1, 1983
14.883
-0.841
-5.35%
jan 1, 1984
20.997
+6.114
41.08%
jan 1, 1985
22.236
+1.24
5.9%
jan 1, 1986
42.368
+20.131
90.53%
jan 1, 1987
34.099
-8.269
-19.52%
jan 1, 1988
17.985
-16.114
-47.26%
jan 1, 1989
15.396
-2.589
-14.4%
jan 1, 1990
15.42
+0.025
0.16%
jan 1, 1991
10.414
-5.006
-32.46%
jan 1, 1992
11.645
+1.231
11.82%
jan 1, 1993
12.635
+0.99
8.5%
jan 1, 1994
7.626
-5.009
-39.64%
jan 1, 1995
6.869
-0.757
-9.93%
jan 1, 1996
1.315
-5.554
-80.86%
jan 1, 1997
7.917
+6.602
502.24%
Ranking of countries by current statistics by years


Comments: