29
/
en
AIzaSyAYiBZKx7MnpbEhh9jyipgxe19OcubqV5w
April 1, 2024
144780
Guatemala
GTM
true
2
1
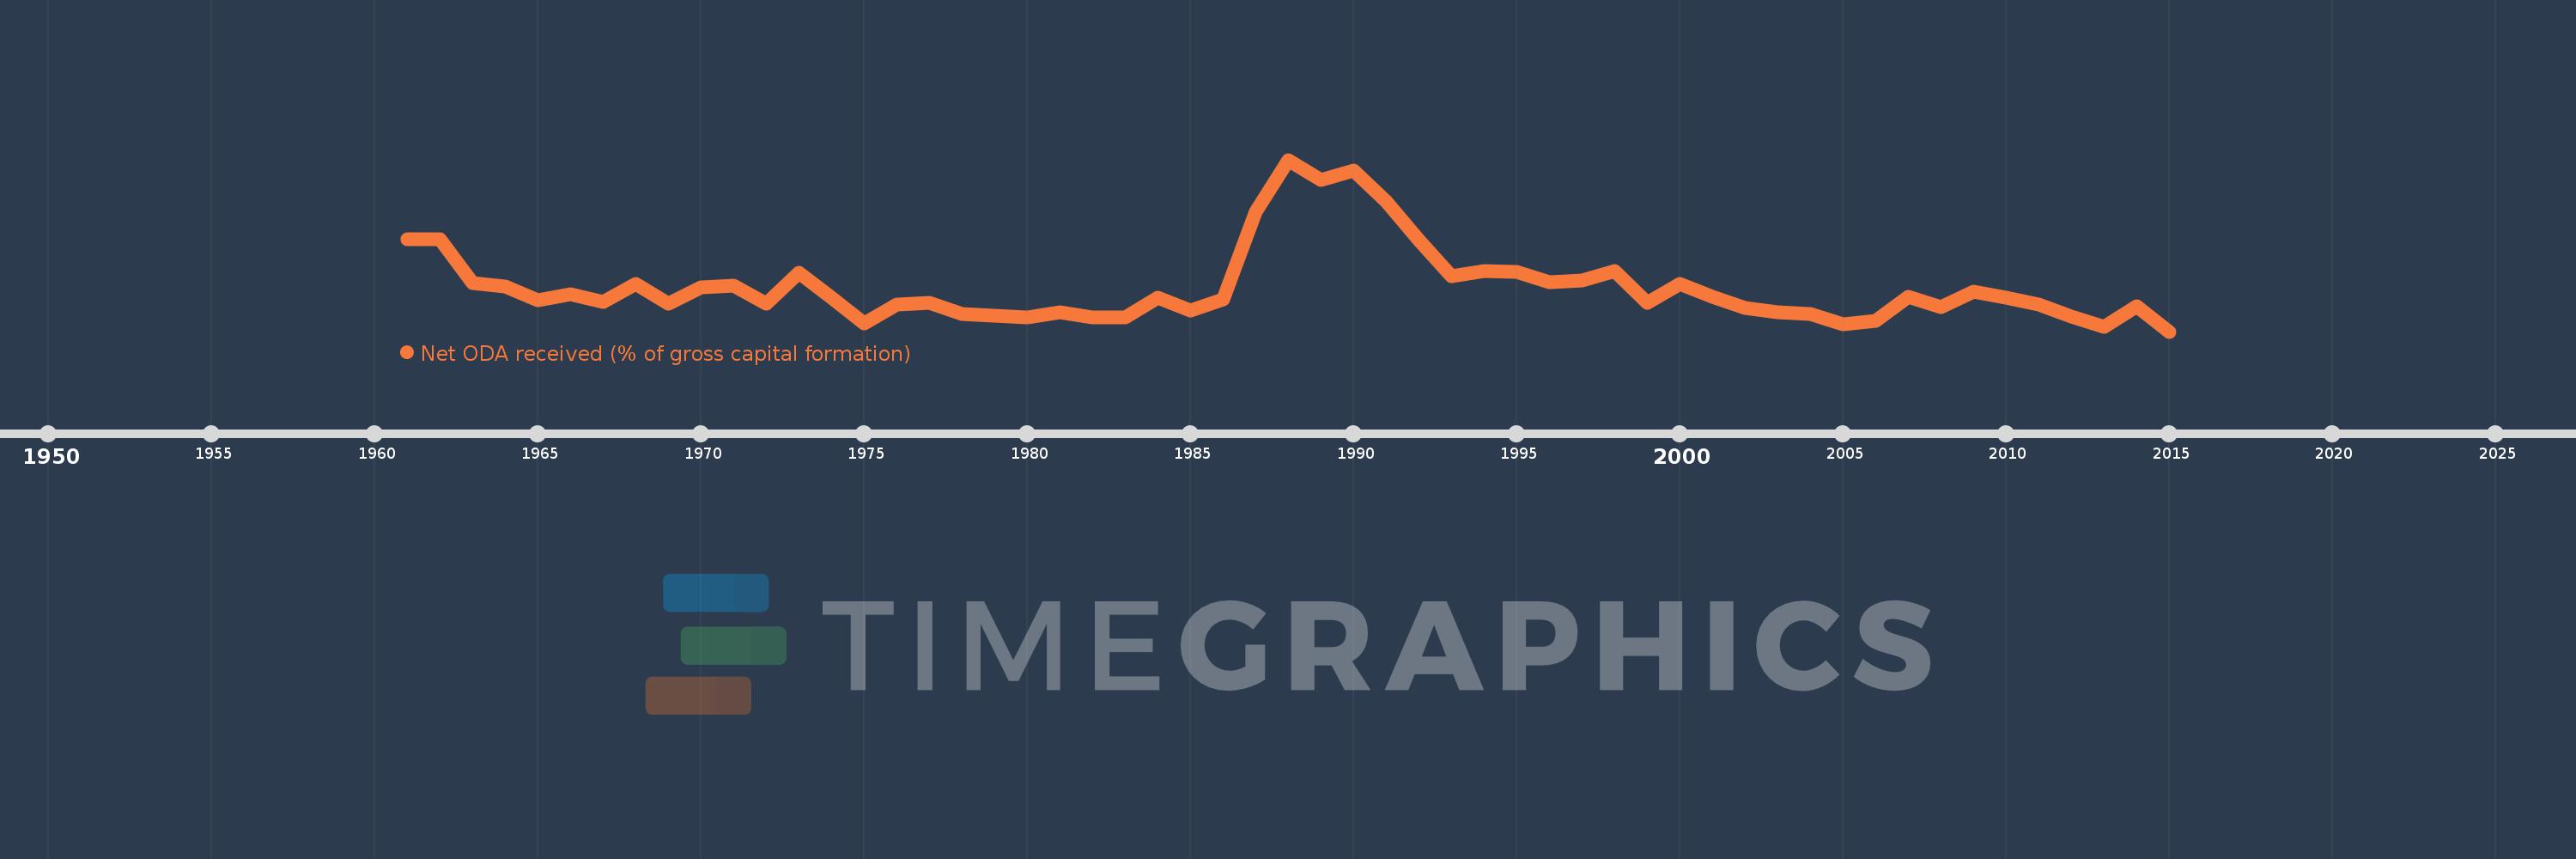
Net ODA received (% of gross capital formation)
2015,2014,2013,2012,2011,2010,2009,2008,2007,2006,2005,2004,2003,2002,2001,2000,1999,1998,1997,1996,1995,1994,1993,1992,1991,1990,1989,1988,1987,1986,1985,1984,1983,1982,1981,1980,1979,1978,1977,1976,1975,1974,1973,1972,1971,1970,1969,1968,1967,1966,1965,1964,1963,1962,1961
This statistics in other country:
AfghanistanAlbaniaAlgeriaAngolaAntigua and BarbudaArab WorldArgentinaArmeniaArubaAzerbaijanBahamas, TheBahrainBangladeshBarbadosBelarusBelizeBeninBhutanBoliviaBosnia and HerzegovinaBotswanaBrazilBrunei DarussalamBurkina FasoBurundiCabo VerdeCambodiaCameroonCaribbean small statesCentral African RepublicCentral Europe and the BalticsChadChileChinaColombiaComorosCongo, Dem. Rep.Congo, Rep.Costa RicaCote d'IvoireCroatiaCubaCyprusDjiboutiDominicaDominican RepublicEast Asia & PacificEast Asia & Pacific (excluding high income)East Asia & Pacific (IDA & IBRD countries)EcuadorEgypt, Arab Rep.El SalvadorEquatorial GuineaEritreaEthiopiaEuro areaEurope & Central AsiaEurope & Central Asia (excluding high income)Europe & Central Asia (IDA & IBRD countries)European UnionFijiFragile and conflict affected situationsGabonGambia, TheGeorgiaGhanaGrenadaGuatemalaGuineaGuinea-BissauGuyanaHaitiHeavily indebted poor countries (HIPC)High incomeHondurasHong Kong SAR, ChinaIBRD onlyIDA & IBRD totalIDA blendIDA onlyIDA totalIndiaIndonesiaIran, Islamic Rep.IraqIsraelJamaicaJordanKazakhstanKenyaKiribatiKorea, Rep.KosovoKuwaitKyrgyz RepublicLao PDRLatin America & Caribbean Latin America & Caribbean (excluding high income)Latin America & the Caribbean (IDA & IBRD countries)Least developed countries: UN classificationLebanonLesothoLiberiaLibyaLow & middle incomeLow incomeLower middle incomeMacao SAR, ChinaMacedonia, FYRMadagascarMalawiMalaysiaMaldivesMaliMaltaMauritaniaMauritiusMexicoMiddle East & North AfricaMiddle East & North Africa (excluding high income)Middle East & North Africa (IDA & IBRD countries)Middle incomeMoldovaMongoliaMontenegroMoroccoMozambiqueNamibiaNepalNew CaledoniaNicaraguaNigerNigeriaNorth AmericaOECD membersOmanOther small statesPakistanPanamaPapua New GuineaParaguayPeruPhilippinesQatarRwandaSaudi ArabiaSenegalSerbiaSeychellesSierra LeoneSingaporeSloveniaSmall statesSolomon IslandsSouth AfricaSouth AsiaSouth Asia (IDA & IBRD)South SudanSri LankaSt. Kitts and NevisSt. LuciaSt. Vincent and the GrenadinesSub-Saharan Africa Sub-Saharan Africa (excluding high income)Sub-Saharan Africa (IDA & IBRD countries)SudanSurinameSwazilandSyrian Arab RepublicTajikistanTanzaniaThailandTimor-LesteTogoTongaTrinidad and TobagoTunisiaTurkeyTurkmenistanUgandaUkraineUpper middle incomeUruguayUzbekistanVanuatuVenezuela, RBVietnamWest Bank and GazaWorldYemen, Rep.ZambiaZimbabwe Timeline:
This timeline shows a graph from 1961 to 2015 of Guatemala. No data until 1960. Number of actual observations by date: 55.
Source name:
World Development Indicators
Source organization:
Development Assistance Committee of the Organisation for Economic Co-operation and Development, Geographical Distribution of Financial Flows to Developing Countries, Development Co-operation Report, and International Development Statistics database. Data are available online at: www.oecd.org/dac/stats/idsonline. World Bank gross capital formation estimates are used for the denominator.
Categories, topics:
Aid Effectiveness
Last updated:
apr 23, 2017
Indicators value changes by year
Maximum:
24.403
jan 1, 1988
At the date of observation
Value
Absolute change
Change from previous value
jan 1, 1961
14.707
+14.707
0.0%
jan 1, 1962
14.76
+0.053
0.36%
jan 1, 1963
9.313
-5.448
-36.91%
jan 1, 1964
8.935
-0.378
-4.06%
jan 1, 1965
7.303
-1.631
-18.26%
jan 1, 1966
8.002
+0.699
9.57%
jan 1, 1967
7.066
-0.937
-11.71%
jan 1, 1968
9.288
+2.222
31.45%
jan 1, 1969
6.814
-2.473
-26.63%
jan 1, 1970
8.871
+2.056
30.18%
jan 1, 1971
8.997
+0.126
1.42%
jan 1, 1972
6.855
-2.142
-23.81%
jan 1, 1973
10.64
+3.785
55.22%
jan 1, 1974
7.554
-3.086
-29.0%
jan 1, 1975
4.447
-3.107
-41.13%
jan 1, 1976
6.738
+2.291
51.51%
jan 1, 1977
6.965
+0.227
3.36%
jan 1, 1978
5.603
-1.362
-19.56%
jan 1, 1979
5.431
-0.172
-3.06%
jan 1, 1980
5.141
-0.29
-5.34%
jan 1, 1981
5.808
+0.667
12.97%
jan 1, 1982
5.136
-0.672
-11.57%
jan 1, 1983
5.157
+0.021
0.4%
jan 1, 1984
7.549
+2.392
46.4%
jan 1, 1985
5.96
-1.589
-21.04%
jan 1, 1986
7.402
+1.441
24.18%
jan 1, 1987
18.03
+10.628
143.6%
jan 1, 1988
24.403
+6.373
35.35%
jan 1, 1989
21.888
-2.515
-10.31%
jan 1, 1990
23.076
+1.188
5.43%
jan 1, 1991
19.351
-3.725
-16.14%
jan 1, 1992
14.609
-4.743
-24.51%
jan 1, 1993
10.23
-4.379
-29.97%
jan 1, 1994
10.805
+0.575
5.62%
jan 1, 1995
10.717
-0.087
-0.81%
jan 1, 1996
9.446
-1.272
-11.87%
jan 1, 1997
9.672
+0.226
2.4%
jan 1, 1998
10.861
+1.189
12.29%
jan 1, 1999
6.918
-3.943
-36.31%
jan 1, 2000
9.221
+2.303
33.3%
jan 1, 2001
7.649
-1.573
-17.05%
jan 1, 2002
6.372
-1.276
-16.69%
jan 1, 2003
5.844
-0.529
-8.3%
jan 1, 2004
5.546
-0.297
-5.09%
jan 1, 2005
4.346
-1.2
-21.64%
jan 1, 2006
4.778
+0.432
9.94%
jan 1, 2007
7.693
+2.915
61.01%
jan 1, 2008
6.394
-1.299
-16.88%
jan 1, 2009
8.35
+1.956
30.59%
jan 1, 2010
7.625
-0.725
-8.68%
jan 1, 2011
6.753
-0.873
-11.44%
jan 1, 2012
5.226
-1.527
-22.61%
jan 1, 2013
4.024
-1.202
-23.0%
jan 1, 2014
6.564
+2.54
63.12%
jan 1, 2015
3.442
-3.123
-47.57%
Ranking of countries by current statistics by years


Comments: