29
/
en
AIzaSyAYiBZKx7MnpbEhh9jyipgxe19OcubqV5w
April 1, 2024
113979
Cote d'Ivoire
CIV
true
2
1
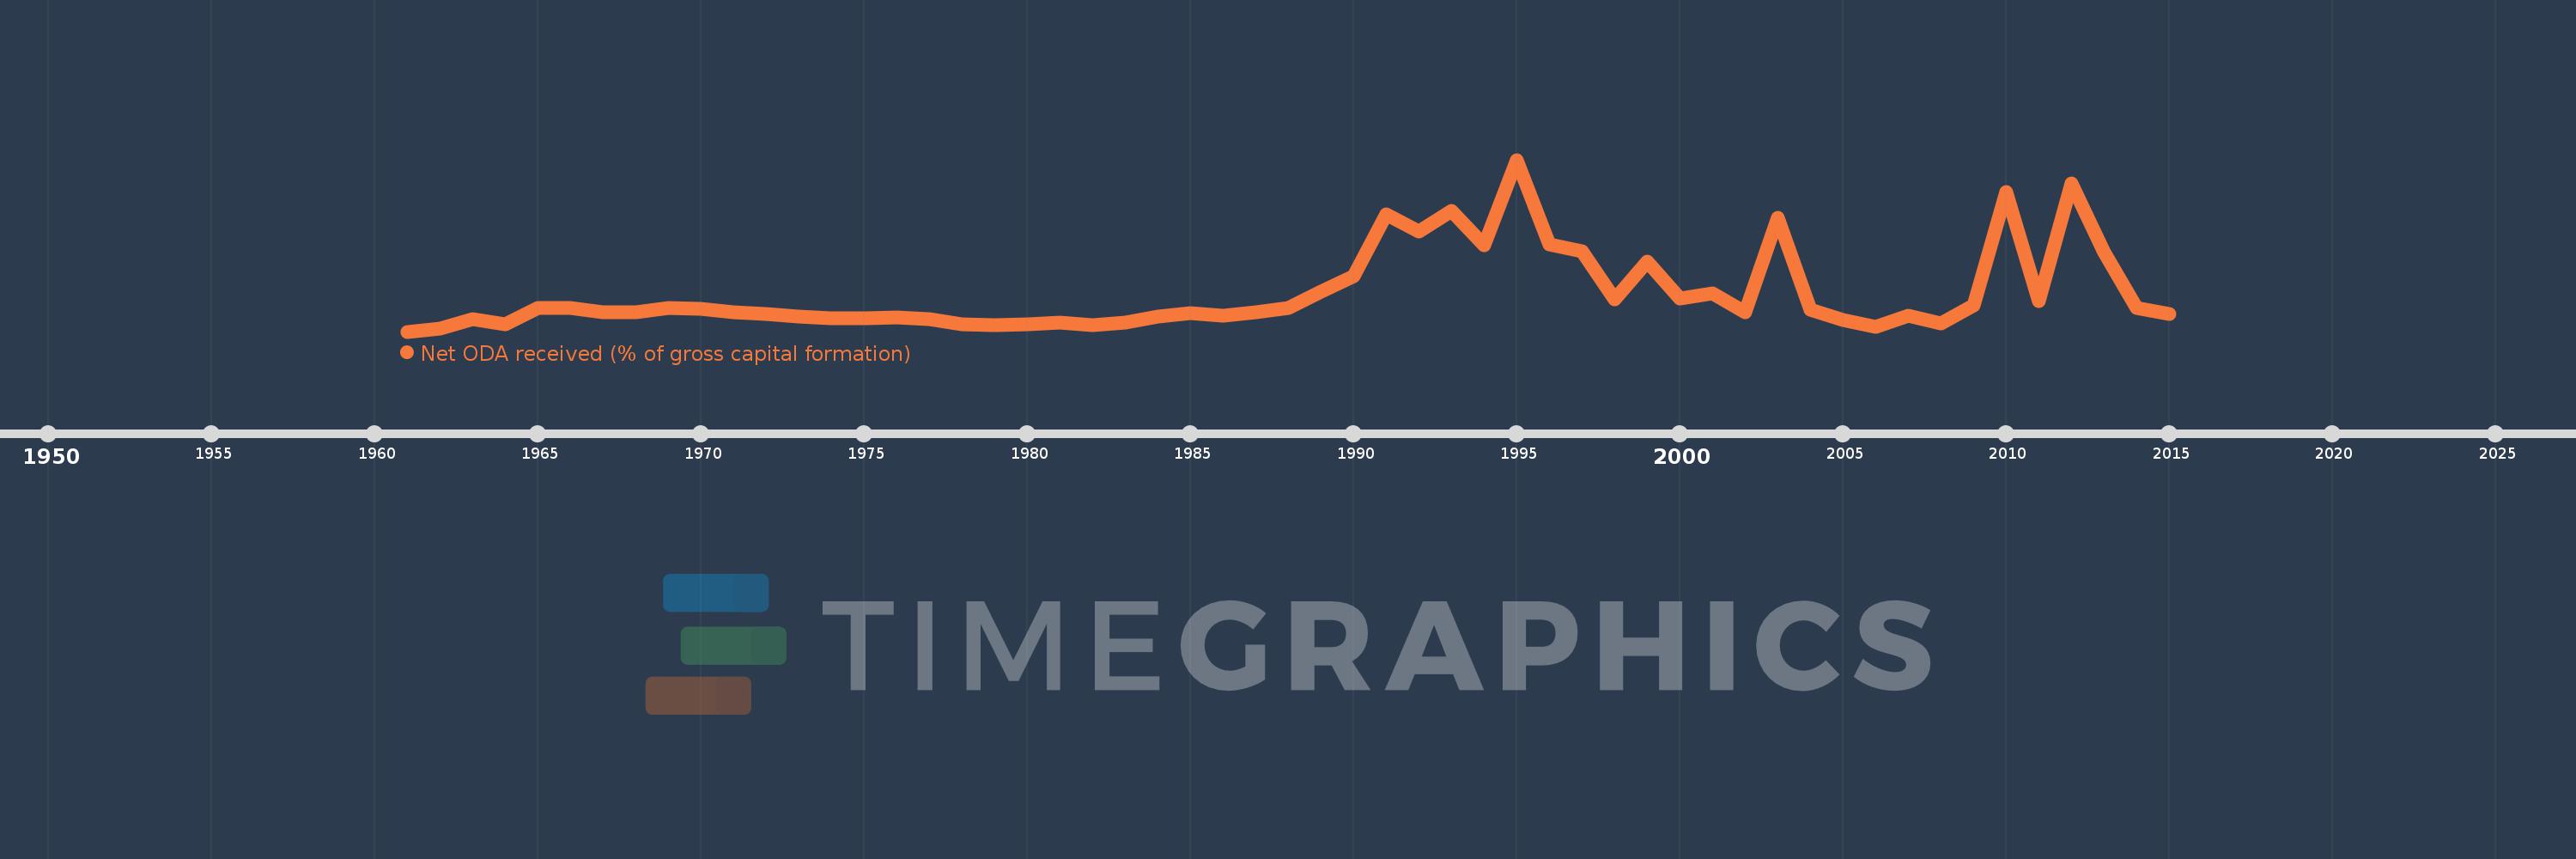
Net ODA received (% of gross capital formation)
2015,2014,2013,2012,2011,2010,2009,2008,2007,2006,2005,2004,2003,2002,2001,2000,1999,1998,1997,1996,1995,1994,1993,1992,1991,1990,1989,1988,1987,1986,1985,1984,1983,1982,1981,1980,1979,1978,1977,1976,1975,1974,1973,1972,1971,1970,1969,1968,1967,1966,1965,1964,1963,1962,1961
This statistics in other country:
AfghanistanAlbaniaAlgeriaAngolaAntigua and BarbudaArab WorldArgentinaArmeniaArubaAzerbaijanBahamas, TheBahrainBangladeshBarbadosBelarusBelizeBeninBhutanBoliviaBosnia and HerzegovinaBotswanaBrazilBrunei DarussalamBurkina FasoBurundiCabo VerdeCambodiaCameroonCaribbean small statesCentral African RepublicCentral Europe and the BalticsChadChileChinaColombiaComorosCongo, Dem. Rep.Congo, Rep.Costa RicaCote d'IvoireCroatiaCubaCyprusDjiboutiDominicaDominican RepublicEast Asia & PacificEast Asia & Pacific (excluding high income)East Asia & Pacific (IDA & IBRD countries)EcuadorEgypt, Arab Rep.El SalvadorEquatorial GuineaEritreaEthiopiaEuro areaEurope & Central AsiaEurope & Central Asia (excluding high income)Europe & Central Asia (IDA & IBRD countries)European UnionFijiFragile and conflict affected situationsGabonGambia, TheGeorgiaGhanaGrenadaGuatemalaGuineaGuinea-BissauGuyanaHaitiHeavily indebted poor countries (HIPC)High incomeHondurasHong Kong SAR, ChinaIBRD onlyIDA & IBRD totalIDA blendIDA onlyIDA totalIndiaIndonesiaIran, Islamic Rep.IraqIsraelJamaicaJordanKazakhstanKenyaKiribatiKorea, Rep.KosovoKuwaitKyrgyz RepublicLao PDRLatin America & Caribbean Latin America & Caribbean (excluding high income)Latin America & the Caribbean (IDA & IBRD countries)Least developed countries: UN classificationLebanonLesothoLiberiaLibyaLow & middle incomeLow incomeLower middle incomeMacao SAR, ChinaMacedonia, FYRMadagascarMalawiMalaysiaMaldivesMaliMaltaMauritaniaMauritiusMexicoMiddle East & North AfricaMiddle East & North Africa (excluding high income)Middle East & North Africa (IDA & IBRD countries)Middle incomeMoldovaMongoliaMontenegroMoroccoMozambiqueNamibiaNepalNew CaledoniaNicaraguaNigerNigeriaNorth AmericaOECD membersOmanOther small statesPakistanPanamaPapua New GuineaParaguayPeruPhilippinesQatarRwandaSaudi ArabiaSenegalSerbiaSeychellesSierra LeoneSingaporeSloveniaSmall statesSolomon IslandsSouth AfricaSouth AsiaSouth Asia (IDA & IBRD)South SudanSri LankaSt. Kitts and NevisSt. LuciaSt. Vincent and the GrenadinesSub-Saharan Africa Sub-Saharan Africa (excluding high income)Sub-Saharan Africa (IDA & IBRD countries)SudanSurinameSwazilandSyrian Arab RepublicTajikistanTanzaniaThailandTimor-LesteTogoTongaTrinidad and TobagoTunisiaTurkeyTurkmenistanUgandaUkraineUpper middle incomeUruguayUzbekistanVanuatuVenezuela, RBVietnamWest Bank and GazaWorldYemen, Rep.ZambiaZimbabwe Timeline:
This timeline shows a graph from 1961 to 2015 of Cote d'Ivoire. No data until 1960. Number of actual observations by date: 55.
Source name:
World Development Indicators
Source organization:
Development Assistance Committee of the Organisation for Economic Co-operation and Development, Geographical Distribution of Financial Flows to Developing Countries, Development Co-operation Report, and International Development Statistics database. Data are available online at: www.oecd.org/dac/stats/idsonline. World Bank gross capital formation estimates are used for the denominator.
Categories, topics:
Aid Effectiveness
Last updated:
apr 23, 2017
Indicators value changes by year
Maximum:
139.713
jan 1, 1995
At the date of observation
Value
Absolute change
Change from previous value
jan 1, 1961
0.142
+0.142
0.0%
jan 1, 1962
2.747
+2.605
1.83K%
jan 1, 1963
10.042
+7.294
265.51%
jan 1, 1964
6.392
-3.65
-36.35%
jan 1, 1965
19.388
+12.997
203.35%
jan 1, 1966
19.197
-0.191
-0.99%
jan 1, 1967
16.088
-3.11
-16.2%
jan 1, 1968
15.88
-0.207
-1.29%
jan 1, 1969
19.647
+3.767
23.72%
jan 1, 1970
18.683
-0.965
-4.91%
jan 1, 1971
16.059
-2.624
-14.04%
jan 1, 1972
14.787
-1.272
-7.92%
jan 1, 1973
12.506
-2.281
-15.43%
jan 1, 1974
10.89
-1.616
-12.92%
jan 1, 1975
11.188
+0.298
2.73%
jan 1, 1976
11.406
+0.218
1.95%
jan 1, 1977
10.025
-1.38
-12.1%
jan 1, 1978
6.07
-3.955
-39.45%
jan 1, 1979
5.51
-0.561
-9.24%
jan 1, 1980
6.255
+0.745
13.52%
jan 1, 1981
7.77
+1.515
24.23%
jan 1, 1982
5.625
-2.144
-27.6%
jan 1, 1983
7.775
+2.15
38.22%
jan 1, 1984
12.336
+4.561
58.66%
jan 1, 1985
15.43
+3.094
25.08%
jan 1, 1986
12.987
-2.443
-15.83%
jan 1, 1987
15.787
+2.801
21.57%
jan 1, 1988
19.354
+3.567
22.59%
jan 1, 1989
32.739
+13.385
69.16%
jan 1, 1990
45.415
+12.675
38.72%
jan 1, 1991
95.054
+49.64
109.3%
jan 1, 1992
81.588
-13.466
-14.17%
jan 1, 1993
97.861
+16.273
19.94%
jan 1, 1994
70.539
-27.322
-27.92%
jan 1, 1995
139.713
+69.175
98.07%
jan 1, 1996
70.626
-69.087
-49.45%
jan 1, 1997
65.576
-5.05
-7.15%
jan 1, 1998
26.396
-39.18
-59.75%
jan 1, 1999
56.718
+30.322
114.87%
jan 1, 2000
27.161
-29.557
-52.11%
jan 1, 2001
31.2
+4.039
14.87%
jan 1, 2002
15.795
-15.405
-49.37%
jan 1, 2003
92.343
+76.548
484.63%
jan 1, 2004
18.253
-74.089
-80.23%
jan 1, 2005
9.599
-8.654
-47.41%
jan 1, 2006
3.83
-5.769
-60.1%
jan 1, 2007
13.108
+9.278
242.25%
jan 1, 2008
6.637
-6.471
-49.37%
jan 1, 2009
21.4
+14.762
222.42%
jan 1, 2010
113.746
+92.346
431.53%
jan 1, 2011
25.26
-88.486
-77.79%
jan 1, 2012
120.228
+94.968
375.97%
jan 1, 2013
64.462
-55.766
-46.38%
jan 1, 2014
19.641
-44.822
-69.53%
jan 1, 2015
14.218
-5.422
-27.61%
Ranking of countries by current statistics by years


Comments: