29
/
en
AIzaSyAYiBZKx7MnpbEhh9jyipgxe19OcubqV5w
April 1, 2024
60101
Sub-Saharan Africa (excluding high income)
SSA
false
2
1
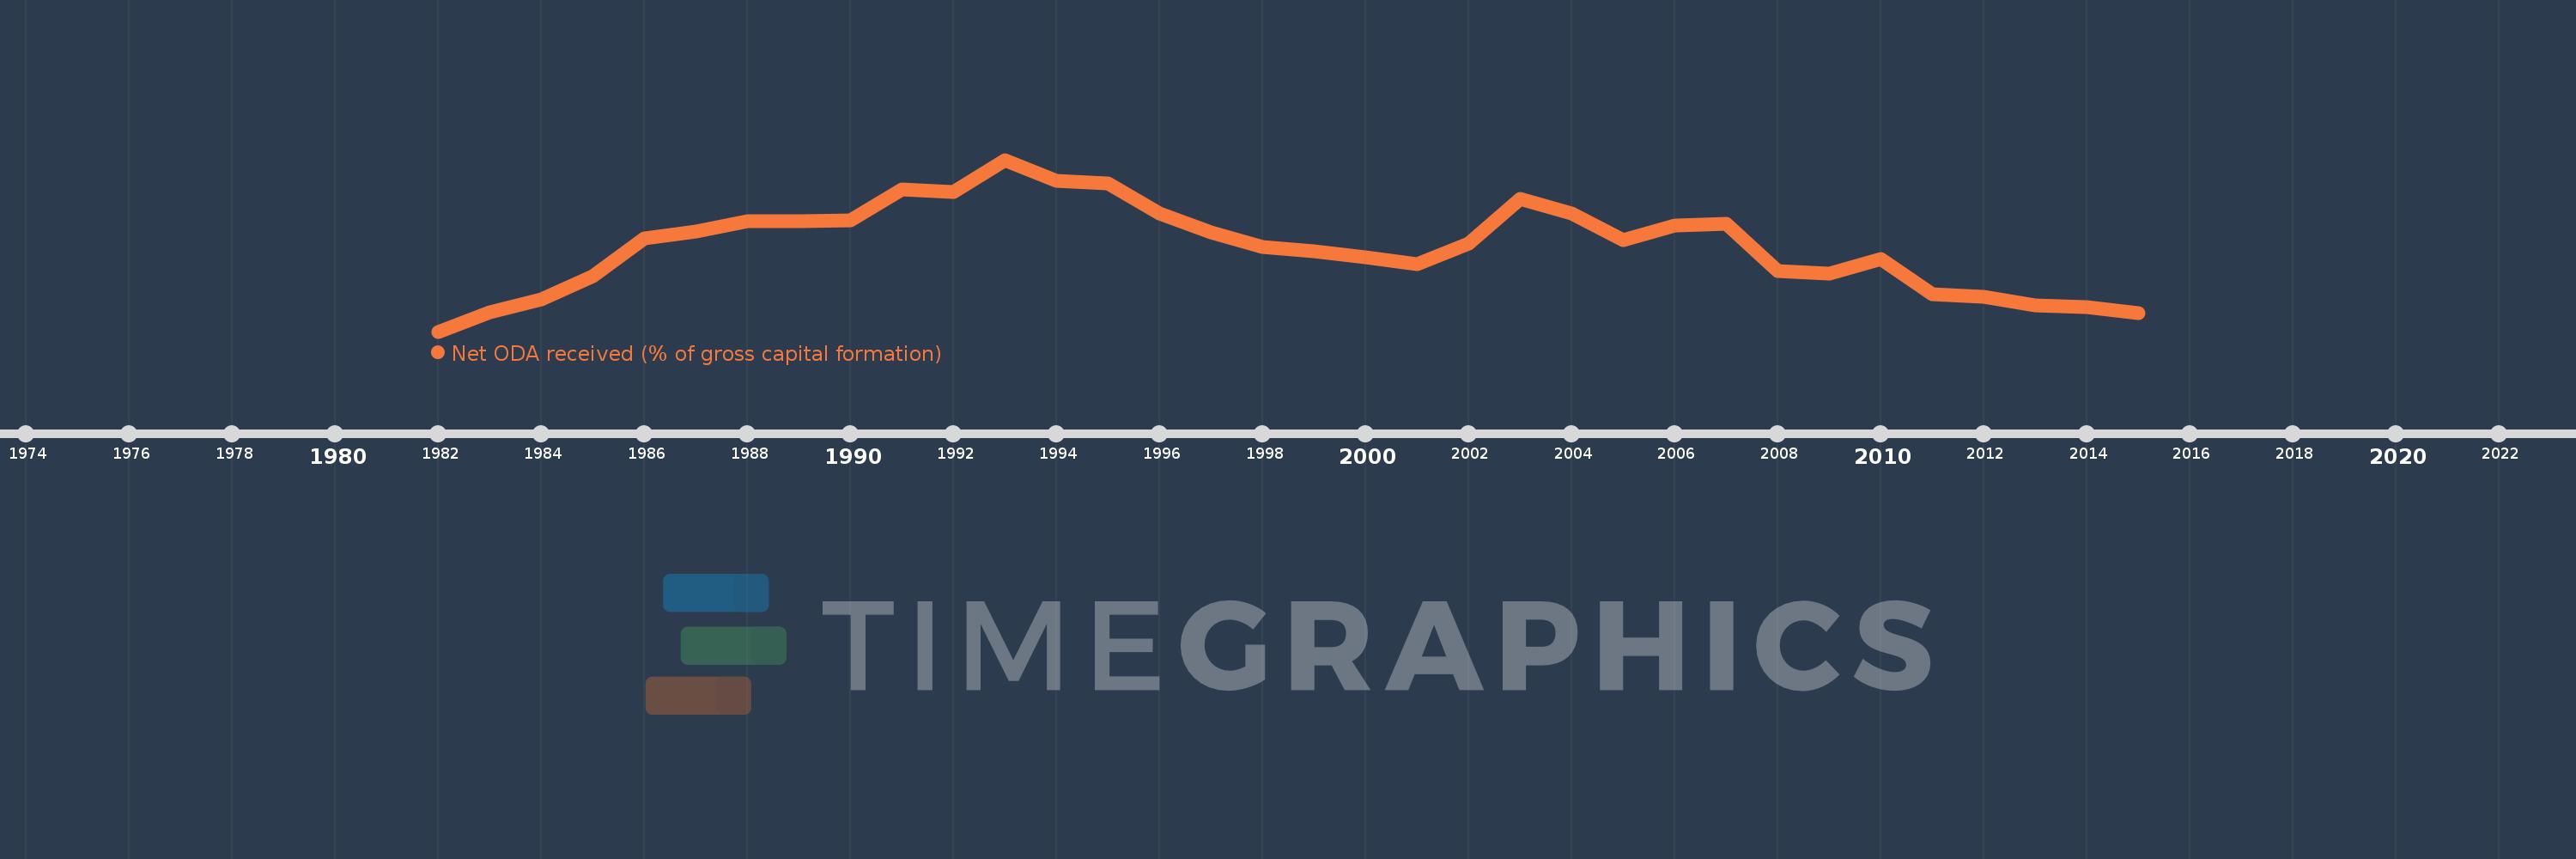
Net ODA received (% of gross capital formation)
2015,2014,2013,2012,2011,2010,2009,2008,2007,2006,2005,2004,2003,2002,2001,2000,1999,1998,1997,1996,1995,1994,1993,1992,1991,1990,1989,1988,1987,1986,1985,1984,1983,1982
This statistics in other country:
AfghanistanAlbaniaAlgeriaAngolaAntigua and BarbudaArab WorldArgentinaArmeniaArubaAzerbaijanBahamas, TheBahrainBangladeshBarbadosBelarusBelizeBeninBhutanBoliviaBosnia and HerzegovinaBotswanaBrazilBrunei DarussalamBurkina FasoBurundiCabo VerdeCambodiaCameroonCaribbean small statesCentral African RepublicCentral Europe and the BalticsChadChileChinaColombiaComorosCongo, Dem. Rep.Congo, Rep.Costa RicaCote d'IvoireCroatiaCubaCyprusDjiboutiDominicaDominican RepublicEast Asia & PacificEast Asia & Pacific (excluding high income)East Asia & Pacific (IDA & IBRD countries)EcuadorEgypt, Arab Rep.El SalvadorEquatorial GuineaEritreaEthiopiaEuro areaEurope & Central AsiaEurope & Central Asia (excluding high income)Europe & Central Asia (IDA & IBRD countries)European UnionFijiFragile and conflict affected situationsGabonGambia, TheGeorgiaGhanaGrenadaGuatemalaGuineaGuinea-BissauGuyanaHaitiHeavily indebted poor countries (HIPC)High incomeHondurasHong Kong SAR, ChinaIBRD onlyIDA & IBRD totalIDA blendIDA onlyIDA totalIndiaIndonesiaIran, Islamic Rep.IraqIsraelJamaicaJordanKazakhstanKenyaKiribatiKorea, Rep.KosovoKuwaitKyrgyz RepublicLao PDRLatin America & Caribbean Latin America & Caribbean (excluding high income)Latin America & the Caribbean (IDA & IBRD countries)Least developed countries: UN classificationLebanonLesothoLiberiaLibyaLow & middle incomeLow incomeLower middle incomeMacao SAR, ChinaMacedonia, FYRMadagascarMalawiMalaysiaMaldivesMaliMaltaMauritaniaMauritiusMexicoMiddle East & North AfricaMiddle East & North Africa (excluding high income)Middle East & North Africa (IDA & IBRD countries)Middle incomeMoldovaMongoliaMontenegroMoroccoMozambiqueNamibiaNepalNew CaledoniaNicaraguaNigerNigeriaNorth AmericaOECD membersOmanOther small statesPakistanPanamaPapua New GuineaParaguayPeruPhilippinesQatarRwandaSaudi ArabiaSenegalSerbiaSeychellesSierra LeoneSingaporeSloveniaSmall statesSolomon IslandsSouth AfricaSouth AsiaSouth Asia (IDA & IBRD)South SudanSri LankaSt. Kitts and NevisSt. LuciaSt. Vincent and the GrenadinesSub-Saharan Africa Sub-Saharan Africa (excluding high income)Sub-Saharan Africa (IDA & IBRD countries)SudanSurinameSwazilandSyrian Arab RepublicTajikistanTanzaniaThailandTimor-LesteTogoTongaTrinidad and TobagoTunisiaTurkeyTurkmenistanUgandaUkraineUpper middle incomeUruguayUzbekistanVanuatuVenezuela, RBVietnamWest Bank and GazaWorldYemen, Rep.ZambiaZimbabwe Timeline:
This timeline shows a graph from 1982 to 2015 of Sub-Saharan Africa (excluding high income). No data until 1981. Number of actual observations by date: 34.
Source name:
World Development Indicators
Source organization:
Development Assistance Committee of the Organisation for Economic Co-operation and Development, Geographical Distribution of Financial Flows to Developing Countries, Development Co-operation Report, and International Development Statistics database. Data are available online at: www.oecd.org/dac/stats/idsonline. World Bank gross capital formation estimates are used for the denominator.
Categories, topics:
Aid Effectiveness
Last updated:
apr 23, 2017
Indicators value changes by year
Maximum:
39.252
jan 1, 1993
At the date of observation
Value
Absolute change
Change from previous value
jan 1, 1982
9.377
+9.377
0.0%
jan 1, 1983
12.799
+3.422
36.5%
jan 1, 1984
14.967
+2.168
16.93%
jan 1, 1985
19.0
+4.033
26.95%
jan 1, 1986
25.584
+6.584
34.65%
jan 1, 1987
26.779
+1.195
4.67%
jan 1, 1988
28.502
+1.722
6.43%
jan 1, 1989
28.511
+0.009
0.03%
jan 1, 1990
28.788
+0.277
0.97%
jan 1, 1991
34.164
+5.376
18.67%
jan 1, 1992
33.604
-0.56
-1.64%
jan 1, 1993
39.252
+5.647
16.81%
jan 1, 1994
35.6
-3.651
-9.3%
jan 1, 1995
35.181
-0.42
-1.18%
jan 1, 1996
29.91
-5.271
-14.98%
jan 1, 1997
26.622
-3.288
-10.99%
jan 1, 1998
24.062
-2.56
-9.62%
jan 1, 1999
23.277
-0.784
-3.26%
jan 1, 2000
22.354
-0.923
-3.97%
jan 1, 2001
21.169
-1.186
-5.3%
jan 1, 2002
24.682
+3.513
16.6%
jan 1, 2003
32.505
+7.824
31.7%
jan 1, 2004
29.845
-2.66
-8.18%
jan 1, 2005
25.251
-4.594
-15.39%
jan 1, 2006
27.836
+2.585
10.24%
jan 1, 2007
28.196
+0.36
1.29%
jan 1, 2008
19.939
-8.257
-29.28%
jan 1, 2009
19.394
-0.545
-2.74%
jan 1, 2010
22.066
+2.672
13.78%
jan 1, 2011
15.927
-6.139
-27.82%
jan 1, 2012
15.376
-0.551
-3.46%
jan 1, 2013
13.929
-1.447
-9.41%
jan 1, 2014
13.662
-0.266
-1.91%
jan 1, 2015
12.545
-1.118
-8.18%
Ranking of countries by current statistics by years


Comments: