29
/
en
AIzaSyAYiBZKx7MnpbEhh9jyipgxe19OcubqV5w
April 1, 2024
100303
Cameroon
CMR
true
2
1
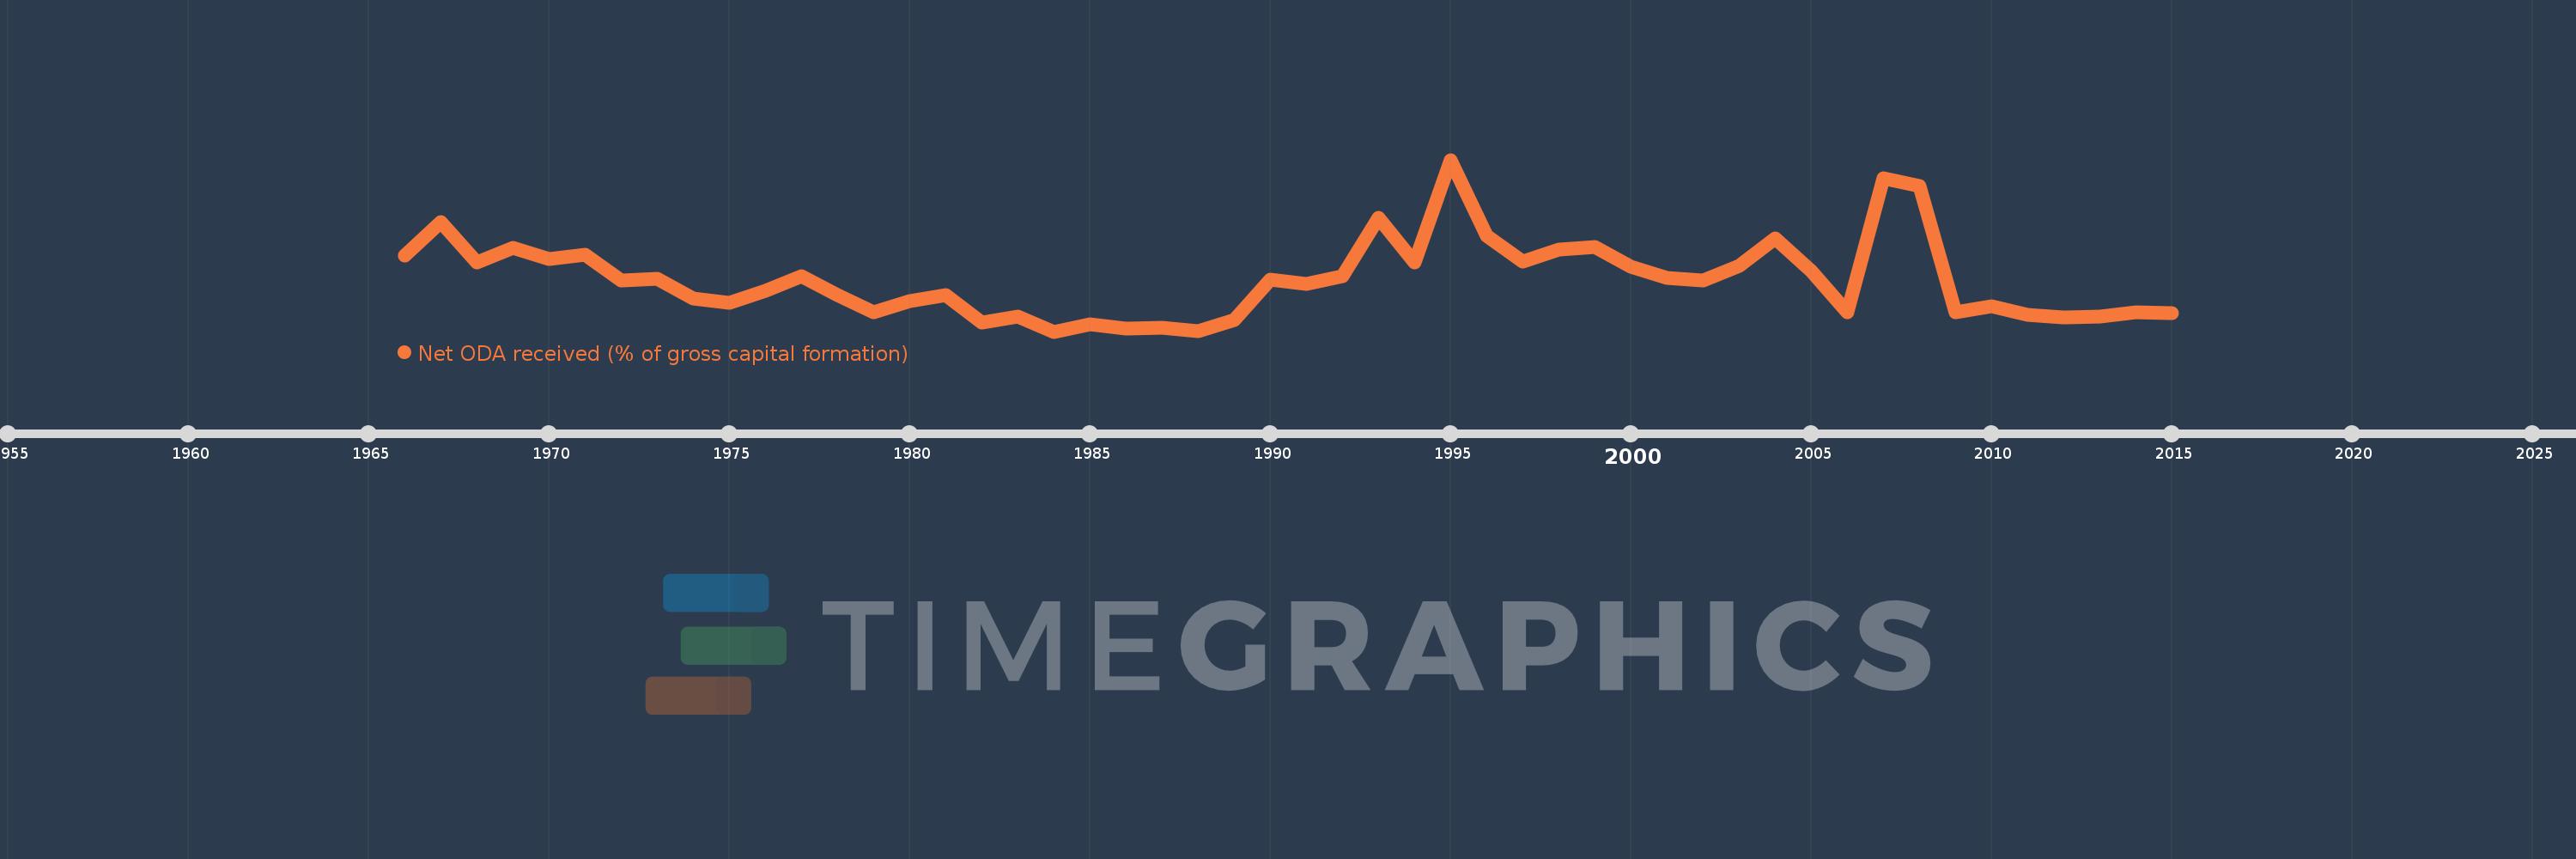
Net ODA received (% of gross capital formation)
2015,2014,2013,2012,2011,2010,2009,2008,2007,2006,2005,2004,2003,2002,2001,2000,1999,1998,1997,1996,1995,1994,1993,1992,1991,1990,1989,1988,1987,1986,1985,1984,1983,1982,1981,1980,1979,1978,1977,1976,1975,1974,1973,1972,1971,1970,1969,1968,1967,1966
This statistics in other country:
AfghanistanAlbaniaAlgeriaAngolaAntigua and BarbudaArab WorldArgentinaArmeniaArubaAzerbaijanBahamas, TheBahrainBangladeshBarbadosBelarusBelizeBeninBhutanBoliviaBosnia and HerzegovinaBotswanaBrazilBrunei DarussalamBurkina FasoBurundiCabo VerdeCambodiaCameroonCaribbean small statesCentral African RepublicCentral Europe and the BalticsChadChileChinaColombiaComorosCongo, Dem. Rep.Congo, Rep.Costa RicaCote d'IvoireCroatiaCubaCyprusDjiboutiDominicaDominican RepublicEast Asia & PacificEast Asia & Pacific (excluding high income)East Asia & Pacific (IDA & IBRD countries)EcuadorEgypt, Arab Rep.El SalvadorEquatorial GuineaEritreaEthiopiaEuro areaEurope & Central AsiaEurope & Central Asia (excluding high income)Europe & Central Asia (IDA & IBRD countries)European UnionFijiFragile and conflict affected situationsGabonGambia, TheGeorgiaGhanaGrenadaGuatemalaGuineaGuinea-BissauGuyanaHaitiHeavily indebted poor countries (HIPC)High incomeHondurasHong Kong SAR, ChinaIBRD onlyIDA & IBRD totalIDA blendIDA onlyIDA totalIndiaIndonesiaIran, Islamic Rep.IraqIsraelJamaicaJordanKazakhstanKenyaKiribatiKorea, Rep.KosovoKuwaitKyrgyz RepublicLao PDRLatin America & Caribbean Latin America & Caribbean (excluding high income)Latin America & the Caribbean (IDA & IBRD countries)Least developed countries: UN classificationLebanonLesothoLiberiaLibyaLow & middle incomeLow incomeLower middle incomeMacao SAR, ChinaMacedonia, FYRMadagascarMalawiMalaysiaMaldivesMaliMaltaMauritaniaMauritiusMexicoMiddle East & North AfricaMiddle East & North Africa (excluding high income)Middle East & North Africa (IDA & IBRD countries)Middle incomeMoldovaMongoliaMontenegroMoroccoMozambiqueNamibiaNepalNew CaledoniaNicaraguaNigerNigeriaNorth AmericaOECD membersOmanOther small statesPakistanPanamaPapua New GuineaParaguayPeruPhilippinesQatarRwandaSaudi ArabiaSenegalSerbiaSeychellesSierra LeoneSingaporeSloveniaSmall statesSolomon IslandsSouth AfricaSouth AsiaSouth Asia (IDA & IBRD)South SudanSri LankaSt. Kitts and NevisSt. LuciaSt. Vincent and the GrenadinesSub-Saharan Africa Sub-Saharan Africa (excluding high income)Sub-Saharan Africa (IDA & IBRD countries)SudanSurinameSwazilandSyrian Arab RepublicTajikistanTanzaniaThailandTimor-LesteTogoTongaTrinidad and TobagoTunisiaTurkeyTurkmenistanUgandaUkraineUpper middle incomeUruguayUzbekistanVanuatuVenezuela, RBVietnamWest Bank and GazaWorldYemen, Rep.ZambiaZimbabwe Timeline:
This timeline shows a graph from 1966 to 2015 of Cameroon. No data until 1965. Number of actual observations by date: 50.
Source name:
World Development Indicators
Source organization:
Development Assistance Committee of the Organisation for Economic Co-operation and Development, Geographical Distribution of Financial Flows to Developing Countries, Development Co-operation Report, and International Development Statistics database. Data are available online at: www.oecd.org/dac/stats/idsonline. World Bank gross capital formation estimates are used for the denominator.
Categories, topics:
Aid Effectiveness
Last updated:
apr 23, 2017
Indicators value changes by year
Maximum:
62.987
jan 1, 1995
At the date of observation
Value
Absolute change
Change from previous value
jan 1, 1966
31.64
+31.64
0.0%
jan 1, 1967
42.679
+11.039
34.89%
jan 1, 1968
29.446
-13.232
-31.0%
jan 1, 1969
34.02
+4.574
15.53%
jan 1, 1970
30.465
-3.555
-10.45%
jan 1, 1971
31.879
+1.414
4.64%
jan 1, 1972
23.459
-8.42
-26.41%
jan 1, 1973
24.075
+0.616
2.63%
jan 1, 1974
17.402
-6.672
-27.72%
jan 1, 1975
16.065
-1.338
-7.69%
jan 1, 1976
19.937
+3.872
24.1%
jan 1, 1977
24.959
+5.022
25.19%
jan 1, 1978
18.709
-6.25
-25.04%
jan 1, 1979
13.034
-5.675
-30.33%
jan 1, 1980
16.702
+3.667
28.14%
jan 1, 1981
18.719
+2.017
12.08%
jan 1, 1982
9.55
-9.169
-48.98%
jan 1, 1983
11.674
+2.124
22.24%
jan 1, 1984
6.657
-5.017
-42.98%
jan 1, 1985
9.041
+2.383
35.8%
jan 1, 1986
7.52
-1.521
-16.82%
jan 1, 1987
7.989
+0.469
6.24%
jan 1, 1988
6.684
-1.305
-16.33%
jan 1, 1989
10.557
+3.873
57.94%
jan 1, 1990
23.767
+13.21
125.12%
jan 1, 1991
22.372
-1.395
-5.87%
jan 1, 1992
24.902
+2.53
11.31%
jan 1, 1993
43.844
+18.942
76.06%
jan 1, 1994
29.39
-14.454
-32.97%
jan 1, 1995
62.987
+33.596
114.31%
jan 1, 1996
38.133
-24.854
-39.46%
jan 1, 1997
29.597
-8.536
-22.38%
jan 1, 1998
33.499
+3.902
13.18%
jan 1, 1999
34.325
+0.826
2.47%
jan 1, 2000
27.871
-6.454
-18.8%
jan 1, 2001
24.259
-3.612
-12.96%
jan 1, 2002
23.396
-0.864
-3.56%
jan 1, 2003
28.14
+4.744
20.28%
jan 1, 2004
37.174
+9.035
32.11%
jan 1, 2005
26.505
-10.669
-28.7%
jan 1, 2006
13.087
-13.418
-50.62%
jan 1, 2007
56.939
+43.853
335.09%
jan 1, 2008
54.477
-2.463
-4.33%
jan 1, 2009
12.912
-41.565
-76.3%
jan 1, 2010
14.974
+2.063
15.98%
jan 1, 2011
12.025
-2.949
-19.7%
jan 1, 2012
11.166
-0.859
-7.14%
jan 1, 2013
11.623
+0.457
4.09%
jan 1, 2014
12.968
+1.345
11.57%
jan 1, 2015
12.824
-0.144
-1.11%
Ranking of countries by current statistics by years


Comments: