29
/
en
AIzaSyAYiBZKx7MnpbEhh9jyipgxe19OcubqV5w
April 1, 2024
41744
Latin America & Caribbean
LCN
false
2
1
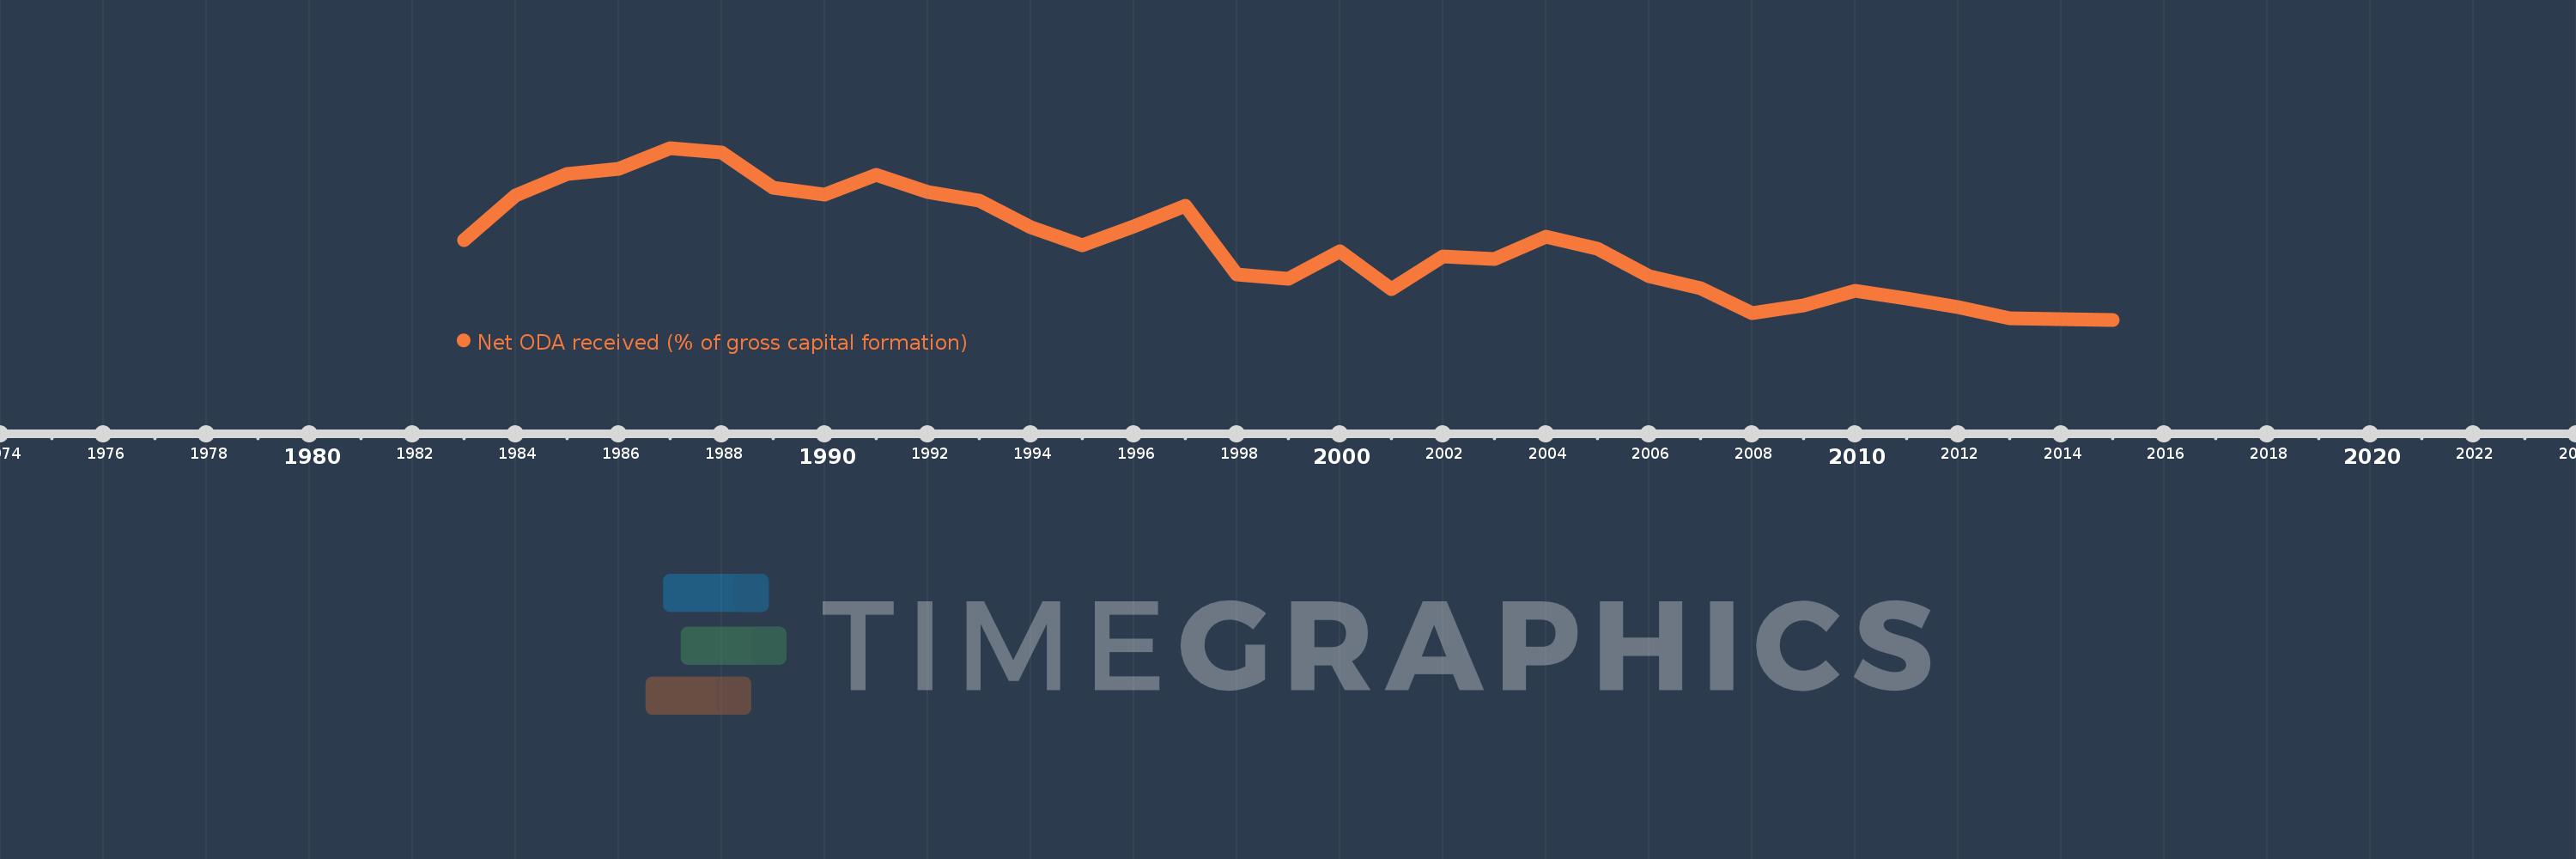
Net ODA received (% of gross capital formation)
2015,2014,2013,2012,2011,2010,2009,2008,2007,2006,2005,2004,2003,2002,2001,2000,1999,1998,1997,1996,1995,1994,1993,1992,1991,1990,1989,1988,1987,1986,1985,1984,1983
This statistics in other country:
AfghanistanAlbaniaAlgeriaAngolaAntigua and BarbudaArab WorldArgentinaArmeniaArubaAzerbaijanBahamas, TheBahrainBangladeshBarbadosBelarusBelizeBeninBhutanBoliviaBosnia and HerzegovinaBotswanaBrazilBrunei DarussalamBurkina FasoBurundiCabo VerdeCambodiaCameroonCaribbean small statesCentral African RepublicCentral Europe and the BalticsChadChileChinaColombiaComorosCongo, Dem. Rep.Congo, Rep.Costa RicaCote d'IvoireCroatiaCubaCyprusDjiboutiDominicaDominican RepublicEast Asia & PacificEast Asia & Pacific (excluding high income)East Asia & Pacific (IDA & IBRD countries)EcuadorEgypt, Arab Rep.El SalvadorEquatorial GuineaEritreaEthiopiaEuro areaEurope & Central AsiaEurope & Central Asia (excluding high income)Europe & Central Asia (IDA & IBRD countries)European UnionFijiFragile and conflict affected situationsGabonGambia, TheGeorgiaGhanaGrenadaGuatemalaGuineaGuinea-BissauGuyanaHaitiHeavily indebted poor countries (HIPC)High incomeHondurasHong Kong SAR, ChinaIBRD onlyIDA & IBRD totalIDA blendIDA onlyIDA totalIndiaIndonesiaIran, Islamic Rep.IraqIsraelJamaicaJordanKazakhstanKenyaKiribatiKorea, Rep.KosovoKuwaitKyrgyz RepublicLao PDRLatin America & Caribbean Latin America & Caribbean (excluding high income)Latin America & the Caribbean (IDA & IBRD countries)Least developed countries: UN classificationLebanonLesothoLiberiaLibyaLow & middle incomeLow incomeLower middle incomeMacao SAR, ChinaMacedonia, FYRMadagascarMalawiMalaysiaMaldivesMaliMaltaMauritaniaMauritiusMexicoMiddle East & North AfricaMiddle East & North Africa (excluding high income)Middle East & North Africa (IDA & IBRD countries)Middle incomeMoldovaMongoliaMontenegroMoroccoMozambiqueNamibiaNepalNew CaledoniaNicaraguaNigerNigeriaNorth AmericaOECD membersOmanOther small statesPakistanPanamaPapua New GuineaParaguayPeruPhilippinesQatarRwandaSaudi ArabiaSenegalSerbiaSeychellesSierra LeoneSingaporeSloveniaSmall statesSolomon IslandsSouth AfricaSouth AsiaSouth Asia (IDA & IBRD)South SudanSri LankaSt. Kitts and NevisSt. LuciaSt. Vincent and the GrenadinesSub-Saharan Africa Sub-Saharan Africa (excluding high income)Sub-Saharan Africa (IDA & IBRD countries)SudanSurinameSwazilandSyrian Arab RepublicTajikistanTanzaniaThailandTimor-LesteTogoTongaTrinidad and TobagoTunisiaTurkeyTurkmenistanUgandaUkraineUpper middle incomeUruguayUzbekistanVanuatuVenezuela, RBVietnamWest Bank and GazaWorldYemen, Rep.ZambiaZimbabwe Timeline:
This timeline shows a graph from 1983 to 2015 of Latin America & Caribbean . No data until 1982. Number of actual observations by date: 33.
Source name:
World Development Indicators
Source organization:
Development Assistance Committee of the Organisation for Economic Co-operation and Development, Geographical Distribution of Financial Flows to Developing Countries, Development Co-operation Report, and International Development Statistics database. Data are available online at: www.oecd.org/dac/stats/idsonline. World Bank gross capital formation estimates are used for the denominator.
Categories, topics:
Aid Effectiveness
Last updated:
apr 23, 2017
Indicators value changes by year
At the date of observation
Value
Absolute change
Change from previous value
jan 1, 1983
1.567
+1.567
0.0%
jan 1, 1984
2.026
+0.459
29.28%
jan 1, 1985
2.253
+0.227
11.21%
jan 1, 1986
2.304
+0.051
2.28%
jan 1, 1987
2.518
+0.213
9.26%
jan 1, 1988
2.469
-0.049
-1.95%
jan 1, 1989
2.11
-0.359
-14.54%
jan 1, 1990
2.035
-0.075
-3.54%
jan 1, 1991
2.238
+0.203
10.0%
jan 1, 1992
2.063
-0.175
-7.82%
jan 1, 1993
1.979
-0.084
-4.09%
jan 1, 1994
1.698
-0.281
-14.19%
jan 1, 1995
1.519
-0.179
-10.57%
jan 1, 1996
1.712
+0.194
12.76%
jan 1, 1997
1.919
+0.207
12.06%
jan 1, 1998
1.21
-0.709
-36.96%
jan 1, 1999
1.169
-0.041
-3.37%
jan 1, 2000
1.449
+0.28
23.96%
jan 1, 2001
1.068
-0.381
-26.3%
jan 1, 2002
1.397
+0.329
30.79%
jan 1, 2003
1.372
-0.024
-1.75%
jan 1, 2004
1.6
+0.228
16.6%
jan 1, 2005
1.476
-0.124
-7.74%
jan 1, 2006
1.194
-0.282
-19.11%
jan 1, 2007
1.07
-0.124
-10.38%
jan 1, 2008
0.82
-0.25
-23.33%
jan 1, 2009
0.892
+0.072
8.72%
jan 1, 2010
1.043
+0.151
16.93%
jan 1, 2011
0.965
-0.078
-7.51%
jan 1, 2012
0.874
-0.09
-9.36%
jan 1, 2013
0.761
-0.114
-12.99%
jan 1, 2014
0.754
-0.007
-0.86%
jan 1, 2015
0.748
-0.006
-0.79%
Ranking of countries by current statistics by years


Comments: