29
/
en
AIzaSyAYiBZKx7MnpbEhh9jyipgxe19OcubqV5w
April 1, 2024
45397
Low & middle income
LMY
false
2
1
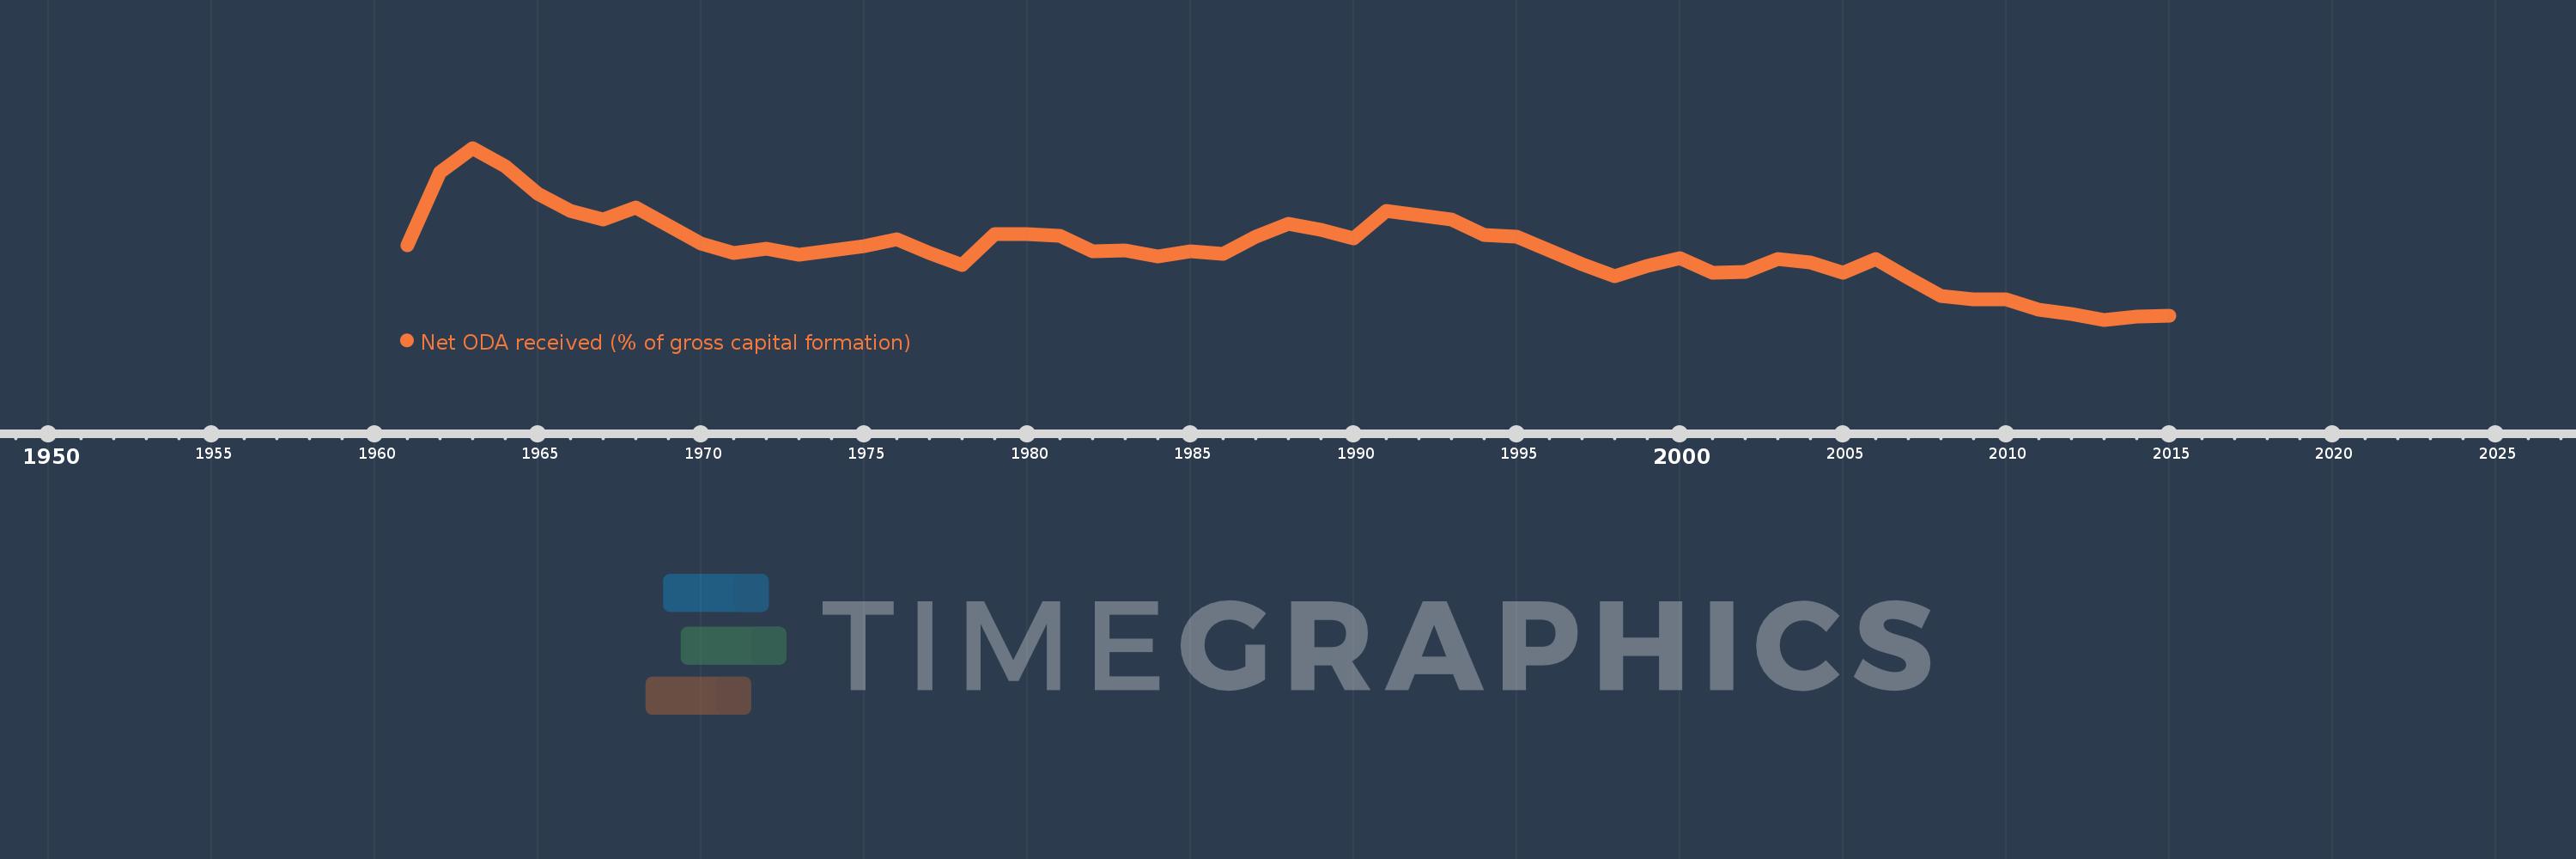
Net ODA received (% of gross capital formation)
2015,2014,2013,2012,2011,2010,2009,2008,2007,2006,2005,2004,2003,2002,2001,2000,1999,1998,1997,1996,1995,1994,1993,1992,1991,1990,1989,1988,1987,1986,1985,1984,1983,1982,1981,1980,1979,1978,1977,1976,1975,1974,1973,1972,1971,1970,1969,1968,1967,1966,1965,1964,1963,1962,1961
This statistics in other country:
AfghanistanAlbaniaAlgeriaAngolaAntigua and BarbudaArab WorldArgentinaArmeniaArubaAzerbaijanBahamas, TheBahrainBangladeshBarbadosBelarusBelizeBeninBhutanBoliviaBosnia and HerzegovinaBotswanaBrazilBrunei DarussalamBurkina FasoBurundiCabo VerdeCambodiaCameroonCaribbean small statesCentral African RepublicCentral Europe and the BalticsChadChileChinaColombiaComorosCongo, Dem. Rep.Congo, Rep.Costa RicaCote d'IvoireCroatiaCubaCyprusDjiboutiDominicaDominican RepublicEast Asia & PacificEast Asia & Pacific (excluding high income)East Asia & Pacific (IDA & IBRD countries)EcuadorEgypt, Arab Rep.El SalvadorEquatorial GuineaEritreaEthiopiaEuro areaEurope & Central AsiaEurope & Central Asia (excluding high income)Europe & Central Asia (IDA & IBRD countries)European UnionFijiFragile and conflict affected situationsGabonGambia, TheGeorgiaGhanaGrenadaGuatemalaGuineaGuinea-BissauGuyanaHaitiHeavily indebted poor countries (HIPC)High incomeHondurasHong Kong SAR, ChinaIBRD onlyIDA & IBRD totalIDA blendIDA onlyIDA totalIndiaIndonesiaIran, Islamic Rep.IraqIsraelJamaicaJordanKazakhstanKenyaKiribatiKorea, Rep.KosovoKuwaitKyrgyz RepublicLao PDRLatin America & Caribbean Latin America & Caribbean (excluding high income)Latin America & the Caribbean (IDA & IBRD countries)Least developed countries: UN classificationLebanonLesothoLiberiaLibyaLow & middle incomeLow incomeLower middle incomeMacao SAR, ChinaMacedonia, FYRMadagascarMalawiMalaysiaMaldivesMaliMaltaMauritaniaMauritiusMexicoMiddle East & North AfricaMiddle East & North Africa (excluding high income)Middle East & North Africa (IDA & IBRD countries)Middle incomeMoldovaMongoliaMontenegroMoroccoMozambiqueNamibiaNepalNew CaledoniaNicaraguaNigerNigeriaNorth AmericaOECD membersOmanOther small statesPakistanPanamaPapua New GuineaParaguayPeruPhilippinesQatarRwandaSaudi ArabiaSenegalSerbiaSeychellesSierra LeoneSingaporeSloveniaSmall statesSolomon IslandsSouth AfricaSouth AsiaSouth Asia (IDA & IBRD)South SudanSri LankaSt. Kitts and NevisSt. LuciaSt. Vincent and the GrenadinesSub-Saharan Africa Sub-Saharan Africa (excluding high income)Sub-Saharan Africa (IDA & IBRD countries)SudanSurinameSwazilandSyrian Arab RepublicTajikistanTanzaniaThailandTimor-LesteTogoTongaTrinidad and TobagoTunisiaTurkeyTurkmenistanUgandaUkraineUpper middle incomeUruguayUzbekistanVanuatuVenezuela, RBVietnamWest Bank and GazaWorldYemen, Rep.ZambiaZimbabwe Timeline:
This timeline shows a graph from 1961 to 2015 of Low & middle income. No data until 1960. Number of actual observations by date: 55.
Source name:
World Development Indicators
Source organization:
Development Assistance Committee of the Organisation for Economic Co-operation and Development, Geographical Distribution of Financial Flows to Developing Countries, Development Co-operation Report, and International Development Statistics database. Data are available online at: www.oecd.org/dac/stats/idsonline. World Bank gross capital formation estimates are used for the denominator.
Categories, topics:
Aid Effectiveness
Last updated:
apr 23, 2017
Indicators value changes by year
At the date of observation
Value
Absolute change
Change from previous value
jan 1, 1961
4.623
+4.623
0.0%
jan 1, 1962
7.593
+2.97
64.24%
jan 1, 1963
8.595
+1.002
13.2%
jan 1, 1964
7.853
-0.742
-8.63%
jan 1, 1965
6.72
-1.133
-14.43%
jan 1, 1966
6.021
-0.699
-10.4%
jan 1, 1967
5.654
-0.367
-6.1%
jan 1, 1968
6.148
+0.495
8.75%
jan 1, 1969
5.406
-0.742
-12.07%
jan 1, 1970
4.694
-0.712
-13.18%
jan 1, 1971
4.29
-0.403
-8.59%
jan 1, 1972
4.455
+0.165
3.84%
jan 1, 1973
4.215
-0.241
-5.4%
jan 1, 1974
4.391
+0.176
4.18%
jan 1, 1975
4.572
+0.182
4.13%
jan 1, 1976
4.856
+0.283
6.2%
jan 1, 1977
4.29
-0.566
-11.66%
jan 1, 1978
3.803
-0.487
-11.35%
jan 1, 1979
5.07
+1.267
33.32%
jan 1, 1980
5.06
-0.01
-0.2%
jan 1, 1981
4.995
-0.065
-1.29%
jan 1, 1982
4.376
-0.62
-12.4%
jan 1, 1983
4.398
+0.023
0.51%
jan 1, 1984
4.155
-0.243
-5.52%
jan 1, 1985
4.366
+0.21
5.06%
jan 1, 1986
4.264
-0.102
-2.34%
jan 1, 1987
4.955
+0.691
16.21%
jan 1, 1988
5.472
+0.517
10.44%
jan 1, 1989
5.235
-0.237
-4.33%
jan 1, 1990
4.879
-0.356
-6.79%
jan 1, 1991
6.016
+1.136
23.29%
jan 1, 1992
5.857
-0.159
-2.64%
jan 1, 1993
5.655
-0.201
-3.43%
jan 1, 1994
5.027
-0.628
-11.11%
jan 1, 1995
4.964
-0.063
-1.26%
jan 1, 1996
4.413
-0.55
-11.09%
jan 1, 1997
3.824
-0.589
-13.36%
jan 1, 1998
3.334
-0.489
-12.8%
jan 1, 1999
3.76
+0.426
12.76%
jan 1, 2000
4.085
+0.325
8.66%
jan 1, 2001
3.49
-0.595
-14.57%
jan 1, 2002
3.51
+0.02
0.56%
jan 1, 2003
4.048
+0.538
15.32%
jan 1, 2004
3.901
-0.146
-3.61%
jan 1, 2005
3.477
-0.425
-10.88%
jan 1, 2006
4.035
+0.559
16.06%
jan 1, 2007
3.274
-0.761
-18.86%
jan 1, 2008
2.517
-0.757
-23.13%
jan 1, 2009
2.387
-0.129
-5.14%
jan 1, 2010
2.407
+0.02
0.83%
jan 1, 2011
1.96
-0.447
-18.57%
jan 1, 2012
1.778
-0.182
-9.29%
jan 1, 2013
1.557
-0.221
-12.46%
jan 1, 2014
1.671
+0.114
7.32%
jan 1, 2015
1.713
+0.043
2.55%
Ranking of countries by current statistics by years


Comments: