29
/
en
AIzaSyAYiBZKx7MnpbEhh9jyipgxe19OcubqV5w
April 1, 2024
116087
Cuba
CUB
true
2
1
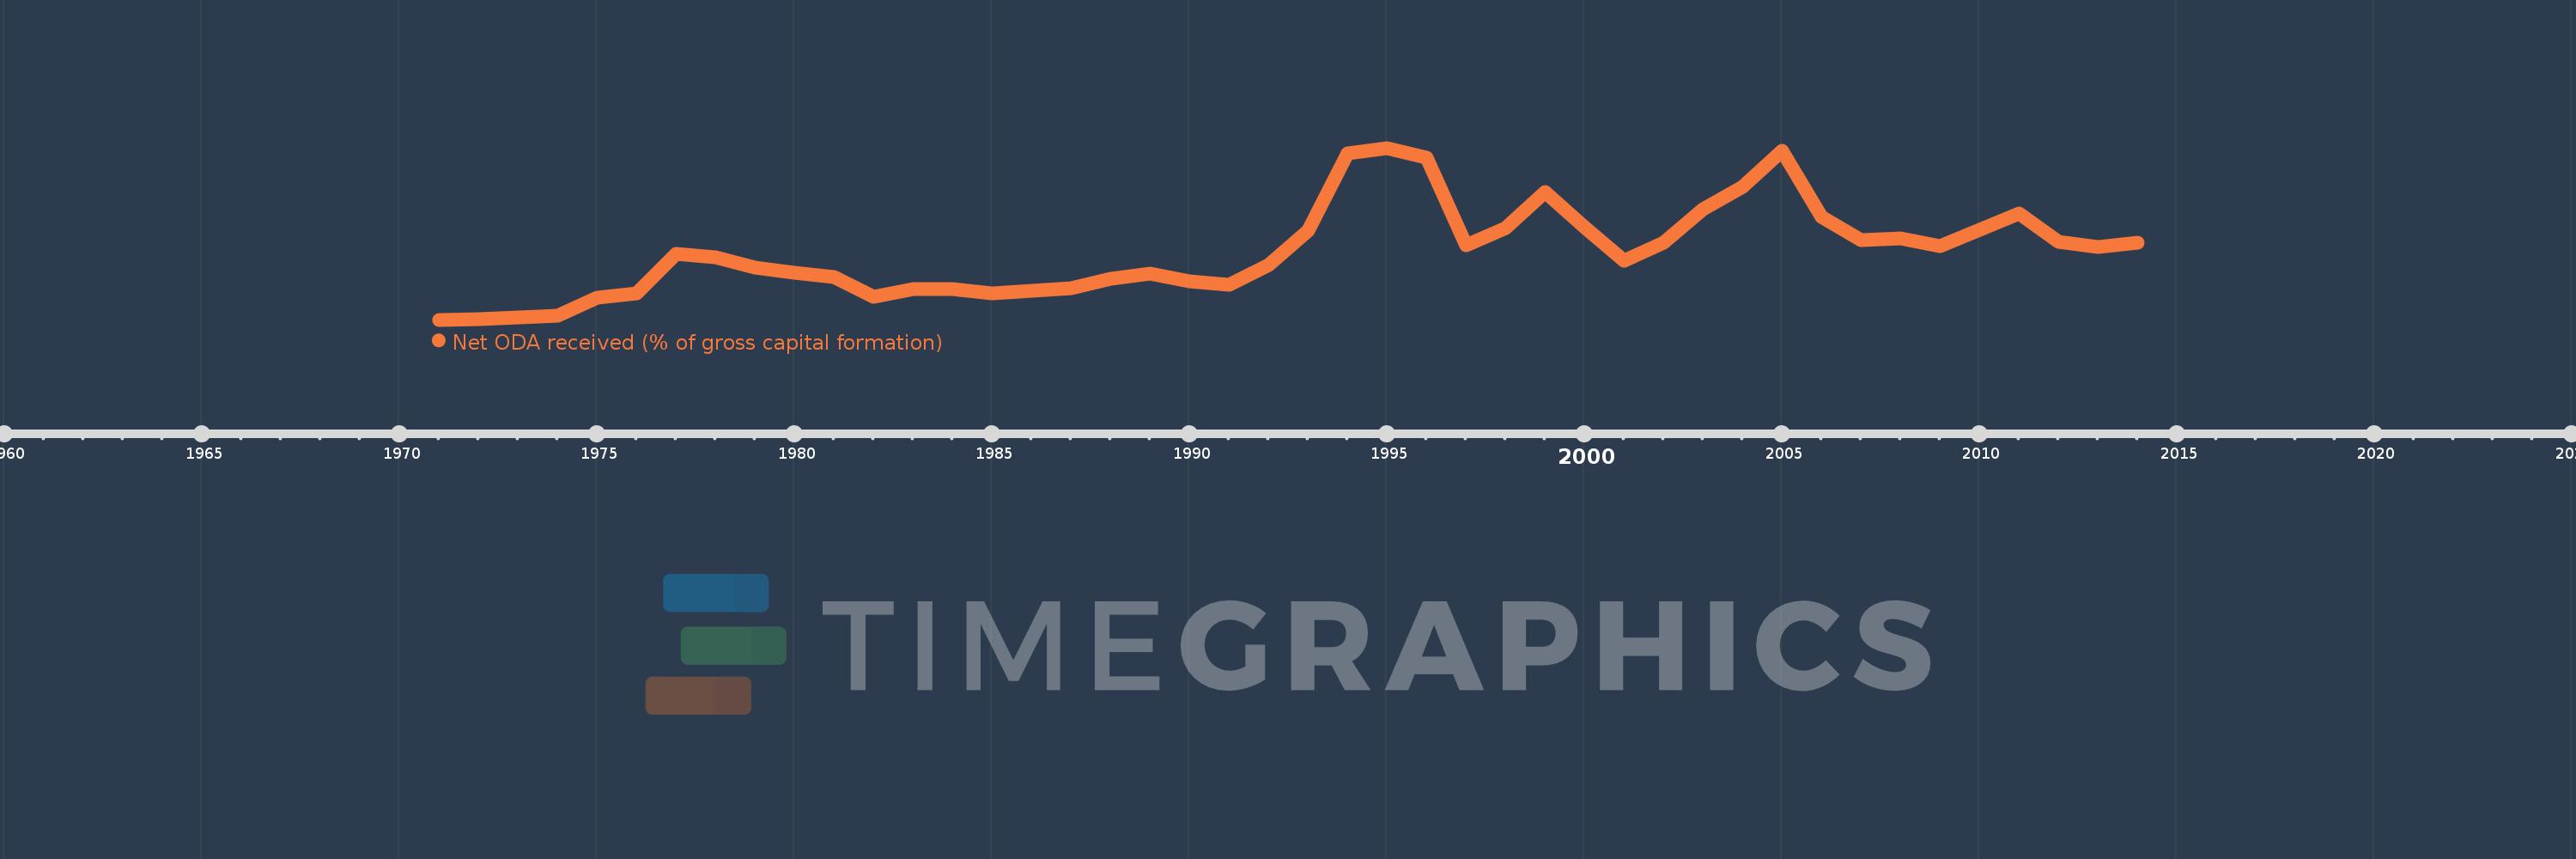
Net ODA received (% of gross capital formation)
2014,2013,2012,2011,2010,2009,2008,2007,2006,2005,2004,2003,2002,2001,2000,1999,1998,1997,1996,1995,1994,1993,1992,1991,1990,1989,1988,1987,1986,1985,1984,1983,1982,1981,1980,1979,1978,1977,1976,1975,1974,1973,1972,1971
This statistics in other country:
AfghanistanAlbaniaAlgeriaAngolaAntigua and BarbudaArab WorldArgentinaArmeniaArubaAzerbaijanBahamas, TheBahrainBangladeshBarbadosBelarusBelizeBeninBhutanBoliviaBosnia and HerzegovinaBotswanaBrazilBrunei DarussalamBurkina FasoBurundiCabo VerdeCambodiaCameroonCaribbean small statesCentral African RepublicCentral Europe and the BalticsChadChileChinaColombiaComorosCongo, Dem. Rep.Congo, Rep.Costa RicaCote d'IvoireCroatiaCubaCyprusDjiboutiDominicaDominican RepublicEast Asia & PacificEast Asia & Pacific (excluding high income)East Asia & Pacific (IDA & IBRD countries)EcuadorEgypt, Arab Rep.El SalvadorEquatorial GuineaEritreaEthiopiaEuro areaEurope & Central AsiaEurope & Central Asia (excluding high income)Europe & Central Asia (IDA & IBRD countries)European UnionFijiFragile and conflict affected situationsGabonGambia, TheGeorgiaGhanaGrenadaGuatemalaGuineaGuinea-BissauGuyanaHaitiHeavily indebted poor countries (HIPC)High incomeHondurasHong Kong SAR, ChinaIBRD onlyIDA & IBRD totalIDA blendIDA onlyIDA totalIndiaIndonesiaIran, Islamic Rep.IraqIsraelJamaicaJordanKazakhstanKenyaKiribatiKorea, Rep.KosovoKuwaitKyrgyz RepublicLao PDRLatin America & Caribbean Latin America & Caribbean (excluding high income)Latin America & the Caribbean (IDA & IBRD countries)Least developed countries: UN classificationLebanonLesothoLiberiaLibyaLow & middle incomeLow incomeLower middle incomeMacao SAR, ChinaMacedonia, FYRMadagascarMalawiMalaysiaMaldivesMaliMaltaMauritaniaMauritiusMexicoMiddle East & North AfricaMiddle East & North Africa (excluding high income)Middle East & North Africa (IDA & IBRD countries)Middle incomeMoldovaMongoliaMontenegroMoroccoMozambiqueNamibiaNepalNew CaledoniaNicaraguaNigerNigeriaNorth AmericaOECD membersOmanOther small statesPakistanPanamaPapua New GuineaParaguayPeruPhilippinesQatarRwandaSaudi ArabiaSenegalSerbiaSeychellesSierra LeoneSingaporeSloveniaSmall statesSolomon IslandsSouth AfricaSouth AsiaSouth Asia (IDA & IBRD)South SudanSri LankaSt. Kitts and NevisSt. LuciaSt. Vincent and the GrenadinesSub-Saharan Africa Sub-Saharan Africa (excluding high income)Sub-Saharan Africa (IDA & IBRD countries)SudanSurinameSwazilandSyrian Arab RepublicTajikistanTanzaniaThailandTimor-LesteTogoTongaTrinidad and TobagoTunisiaTurkeyTurkmenistanUgandaUkraineUpper middle incomeUruguayUzbekistanVanuatuVenezuela, RBVietnamWest Bank and GazaWorldYemen, Rep.ZambiaZimbabwe Timeline:
This timeline shows a graph from 1971 to 2014 of Cuba. No data until 1970. Number of actual observations by date: 44.
Source name:
World Development Indicators
Source organization:
Development Assistance Committee of the Organisation for Economic Co-operation and Development, Geographical Distribution of Financial Flows to Developing Countries, Development Co-operation Report, and International Development Statistics database. Data are available online at: www.oecd.org/dac/stats/idsonline. World Bank gross capital formation estimates are used for the denominator.
Categories, topics:
Aid Effectiveness
Last updated:
apr 23, 2017
Indicators value changes by year
At the date of observation
Value
Absolute change
Change from previous value
jan 1, 1971
0.123
+0.123
0.0%
jan 1, 1972
0.138
+0.015
12.15%
jan 1, 1973
0.169
+0.031
22.37%
jan 1, 1974
0.201
+0.031
18.5%
jan 1, 1975
0.516
+0.315
157.2%
jan 1, 1976
0.581
+0.065
12.57%
jan 1, 1977
1.274
+0.694
119.47%
jan 1, 1978
1.22
-0.054
-4.25%
jan 1, 1979
1.041
-0.179
-14.65%
jan 1, 1980
0.949
-0.092
-8.86%
jan 1, 1981
0.866
-0.083
-8.79%
jan 1, 1982
0.519
-0.346
-39.99%
jan 1, 1983
0.654
+0.135
25.97%
jan 1, 1984
0.655
+0.0
0.06%
jan 1, 1985
0.583
-0.071
-10.89%
jan 1, 1986
0.637
+0.053
9.15%
jan 1, 1987
0.675
+0.038
6.02%
jan 1, 1988
0.848
+0.173
25.64%
jan 1, 1989
0.929
+0.08
9.47%
jan 1, 1990
0.799
-0.13
-13.97%
jan 1, 1991
0.729
-0.07
-8.72%
jan 1, 1992
1.085
+0.356
48.8%
jan 1, 1993
1.688
+0.603
55.56%
jan 1, 1994
3.041
+1.353
80.18%
jan 1, 1995
3.133
+0.091
3.01%
jan 1, 1996
2.962
-0.17
-5.44%
jan 1, 1997
1.429
-1.534
-51.77%
jan 1, 1998
1.722
+0.294
20.55%
jan 1, 1999
2.357
+0.634
36.83%
jan 1, 2000
1.739
-0.617
-26.2%
jan 1, 2001
1.151
-0.588
-33.83%
jan 1, 2002
1.478
+0.327
28.46%
jan 1, 2003
2.061
+0.583
39.44%
jan 1, 2004
2.457
+0.396
19.2%
jan 1, 2005
3.079
+0.622
25.31%
jan 1, 2006
1.924
-1.156
-37.53%
jan 1, 2007
1.515
-0.409
-21.25%
jan 1, 2008
1.555
+0.04
2.65%
jan 1, 2009
1.412
-0.143
-9.18%
jan 1, 2010
1.695
+0.283
20.03%
jan 1, 2011
1.992
+0.297
17.53%
jan 1, 2012
1.49
-0.503
-25.22%
jan 1, 2013
1.4
-0.09
-6.01%
jan 1, 2014
1.476
+0.076
5.45%
Ranking of countries by current statistics by years


Comments: