29
/
en
AIzaSyAYiBZKx7MnpbEhh9jyipgxe19OcubqV5w
April 1, 2024
172016
Kuwait
KWT
true
2
1
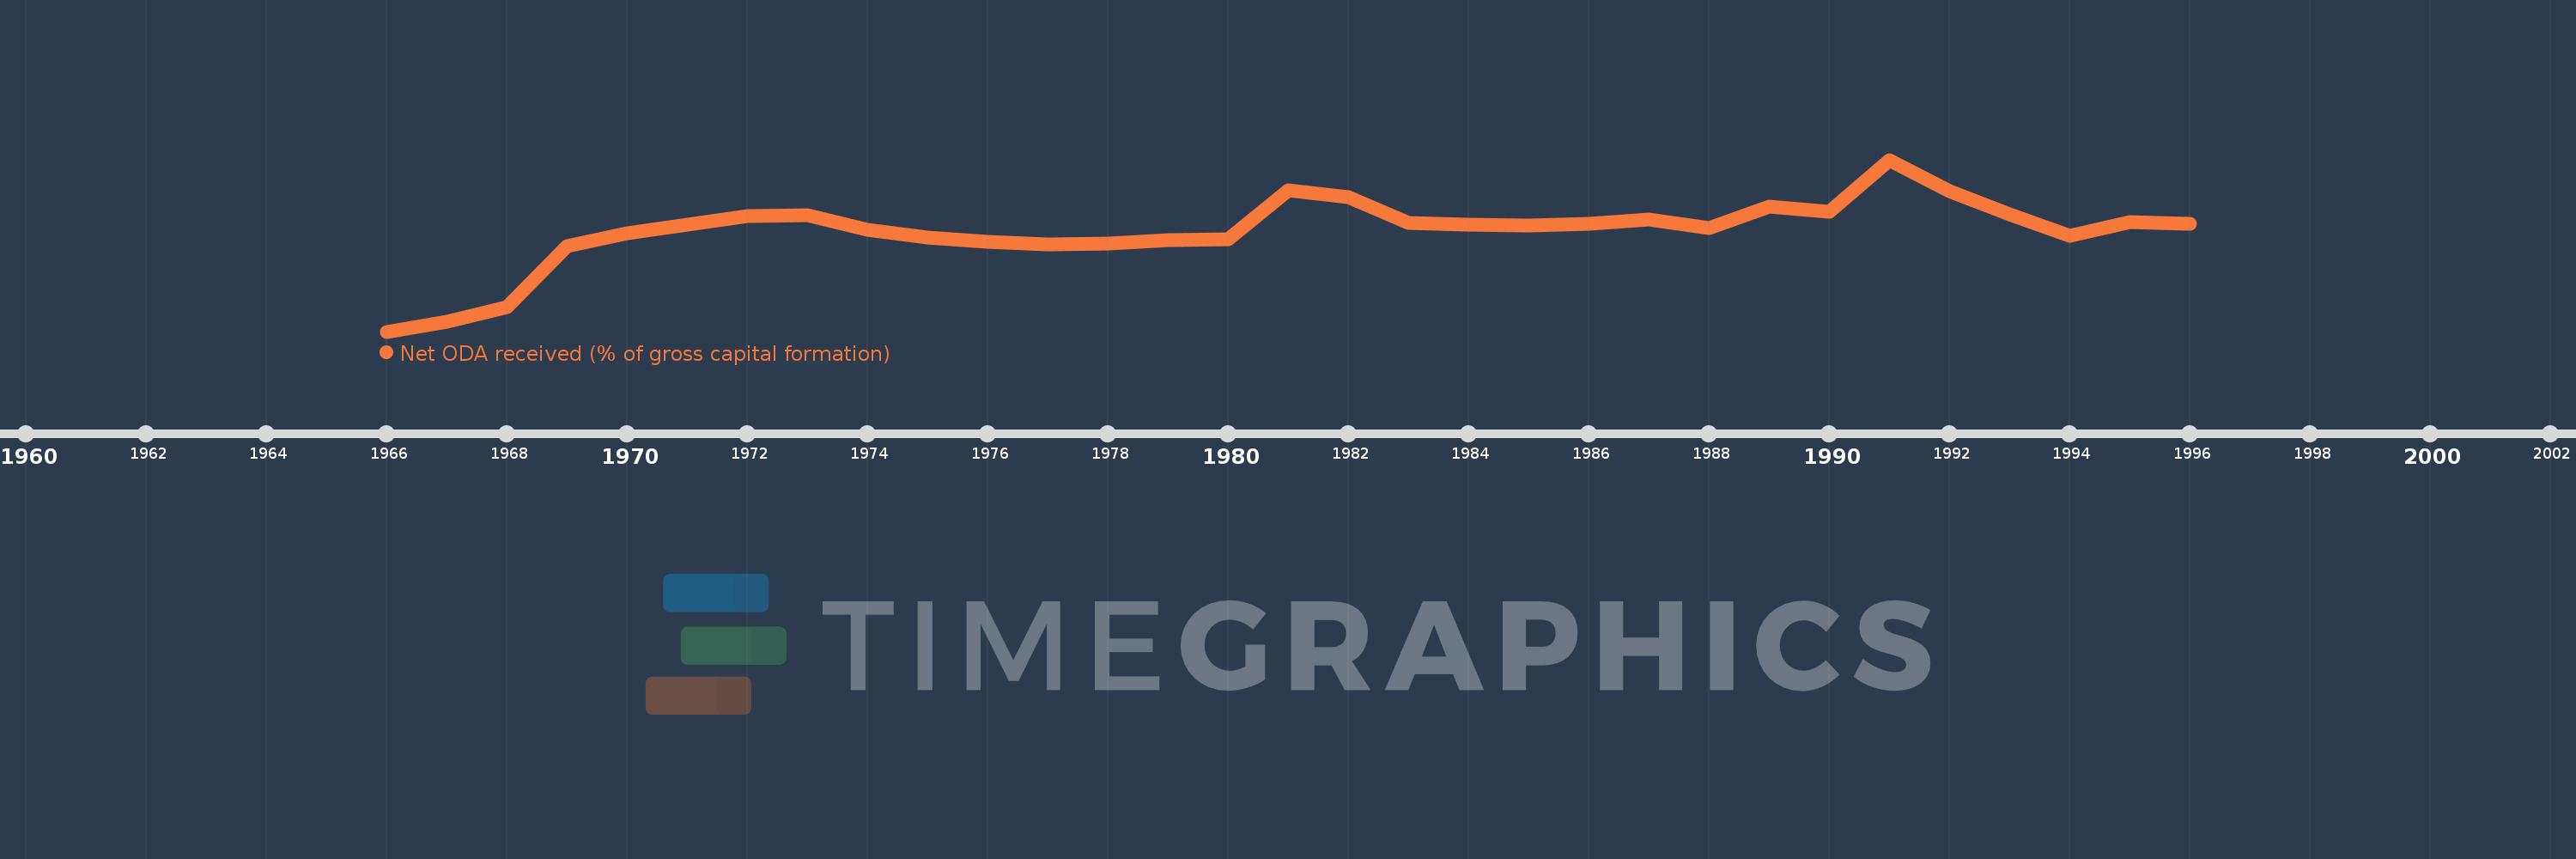
Net ODA received (% of gross capital formation)
1996,1995,1994,1993,1992,1991,1990,1989,1988,1987,1986,1985,1984,1983,1982,1981,1980,1979,1978,1977,1976,1975,1974,1973,1972,1971,1970,1969,1968,1967,1966
This statistics in other country:
AfghanistanAlbaniaAlgeriaAngolaAntigua and BarbudaArab WorldArgentinaArmeniaArubaAzerbaijanBahamas, TheBahrainBangladeshBarbadosBelarusBelizeBeninBhutanBoliviaBosnia and HerzegovinaBotswanaBrazilBrunei DarussalamBurkina FasoBurundiCabo VerdeCambodiaCameroonCaribbean small statesCentral African RepublicCentral Europe and the BalticsChadChileChinaColombiaComorosCongo, Dem. Rep.Congo, Rep.Costa RicaCote d'IvoireCroatiaCubaCyprusDjiboutiDominicaDominican RepublicEast Asia & PacificEast Asia & Pacific (excluding high income)East Asia & Pacific (IDA & IBRD countries)EcuadorEgypt, Arab Rep.El SalvadorEquatorial GuineaEritreaEthiopiaEuro areaEurope & Central AsiaEurope & Central Asia (excluding high income)Europe & Central Asia (IDA & IBRD countries)European UnionFijiFragile and conflict affected situationsGabonGambia, TheGeorgiaGhanaGrenadaGuatemalaGuineaGuinea-BissauGuyanaHaitiHeavily indebted poor countries (HIPC)High incomeHondurasHong Kong SAR, ChinaIBRD onlyIDA & IBRD totalIDA blendIDA onlyIDA totalIndiaIndonesiaIran, Islamic Rep.IraqIsraelJamaicaJordanKazakhstanKenyaKiribatiKorea, Rep.KosovoKuwaitKyrgyz RepublicLao PDRLatin America & Caribbean Latin America & Caribbean (excluding high income)Latin America & the Caribbean (IDA & IBRD countries)Least developed countries: UN classificationLebanonLesothoLiberiaLibyaLow & middle incomeLow incomeLower middle incomeMacao SAR, ChinaMacedonia, FYRMadagascarMalawiMalaysiaMaldivesMaliMaltaMauritaniaMauritiusMexicoMiddle East & North AfricaMiddle East & North Africa (excluding high income)Middle East & North Africa (IDA & IBRD countries)Middle incomeMoldovaMongoliaMontenegroMoroccoMozambiqueNamibiaNepalNew CaledoniaNicaraguaNigerNigeriaNorth AmericaOECD membersOmanOther small statesPakistanPanamaPapua New GuineaParaguayPeruPhilippinesQatarRwandaSaudi ArabiaSenegalSerbiaSeychellesSierra LeoneSingaporeSloveniaSmall statesSolomon IslandsSouth AfricaSouth AsiaSouth Asia (IDA & IBRD)South SudanSri LankaSt. Kitts and NevisSt. LuciaSt. Vincent and the GrenadinesSub-Saharan Africa Sub-Saharan Africa (excluding high income)Sub-Saharan Africa (IDA & IBRD countries)SudanSurinameSwazilandSyrian Arab RepublicTajikistanTanzaniaThailandTimor-LesteTogoTongaTrinidad and TobagoTunisiaTurkeyTurkmenistanUgandaUkraineUpper middle incomeUruguayUzbekistanVanuatuVenezuela, RBVietnamWest Bank and GazaWorldYemen, Rep.ZambiaZimbabwe Timeline:
This timeline shows a graph from 1966 to 1996 of Kuwait. No data until 1965. Number of actual observations by date: 31.
Source name:
World Development Indicators
Source organization:
Development Assistance Committee of the Organisation for Economic Co-operation and Development, Geographical Distribution of Financial Flows to Developing Countries, Development Co-operation Report, and International Development Statistics database. Data are available online at: www.oecd.org/dac/stats/idsonline. World Bank gross capital formation estimates are used for the denominator.
Categories, topics:
Aid Effectiveness
Last updated:
apr 23, 2017
Indicators value changes by year
Minimum:
-0.387
jan 1, 1966
At the date of observation
Value
Absolute change
Change from previous value
jan 1, 1966
-0.387
-0.387
0.0%
jan 1, 1967
-0.341
+0.047
-12.09%
jan 1, 1968
-0.276
+0.064
-18.82%
jan 1, 1969
0.002
+0.279
-100.76%
jan 1, 1970
0.062
+0.06
2.89K%
jan 1, 1971
0.1
+0.038
61.14%
jan 1, 1972
0.14
+0.04
39.48%
jan 1, 1973
0.142
+0.002
1.67%
jan 1, 1974
0.076
-0.067
-46.8%
jan 1, 1975
0.043
-0.033
-43.12%
jan 1, 1976
0.022
-0.022
-49.98%
jan 1, 1977
0.009
-0.013
-59.45%
jan 1, 1978
0.015
+0.007
76.92%
jan 1, 1979
0.03
+0.014
93.67%
jan 1, 1980
0.035
+0.005
15.57%
jan 1, 1981
0.257
+0.222
642.33%
jan 1, 1982
0.226
-0.032
-12.26%
jan 1, 1983
0.108
-0.118
-52.21%
jan 1, 1984
0.1
-0.008
-7.46%
jan 1, 1985
0.098
-0.002
-1.77%
jan 1, 1986
0.104
+0.006
6.27%
jan 1, 1987
0.125
+0.021
20.33%
jan 1, 1988
0.086
-0.039
-31.05%
jan 1, 1989
0.183
+0.096
111.69%
jan 1, 1990
0.158
-0.025
-13.69%
jan 1, 1991
0.396
+0.238
150.83%
jan 1, 1992
0.255
-0.141
-35.54%
jan 1, 1993
0.147
-0.108
-42.39%
jan 1, 1994
0.049
-0.098
-66.46%
jan 1, 1995
0.111
+0.062
125.82%
jan 1, 1996
0.105
-0.006
-5.32%
Ranking of countries by current statistics by years


Comments: