29
/
en
AIzaSyAYiBZKx7MnpbEhh9jyipgxe19OcubqV5w
April 1, 2024
127637
Equatorial Guinea
GNQ
true
2
1
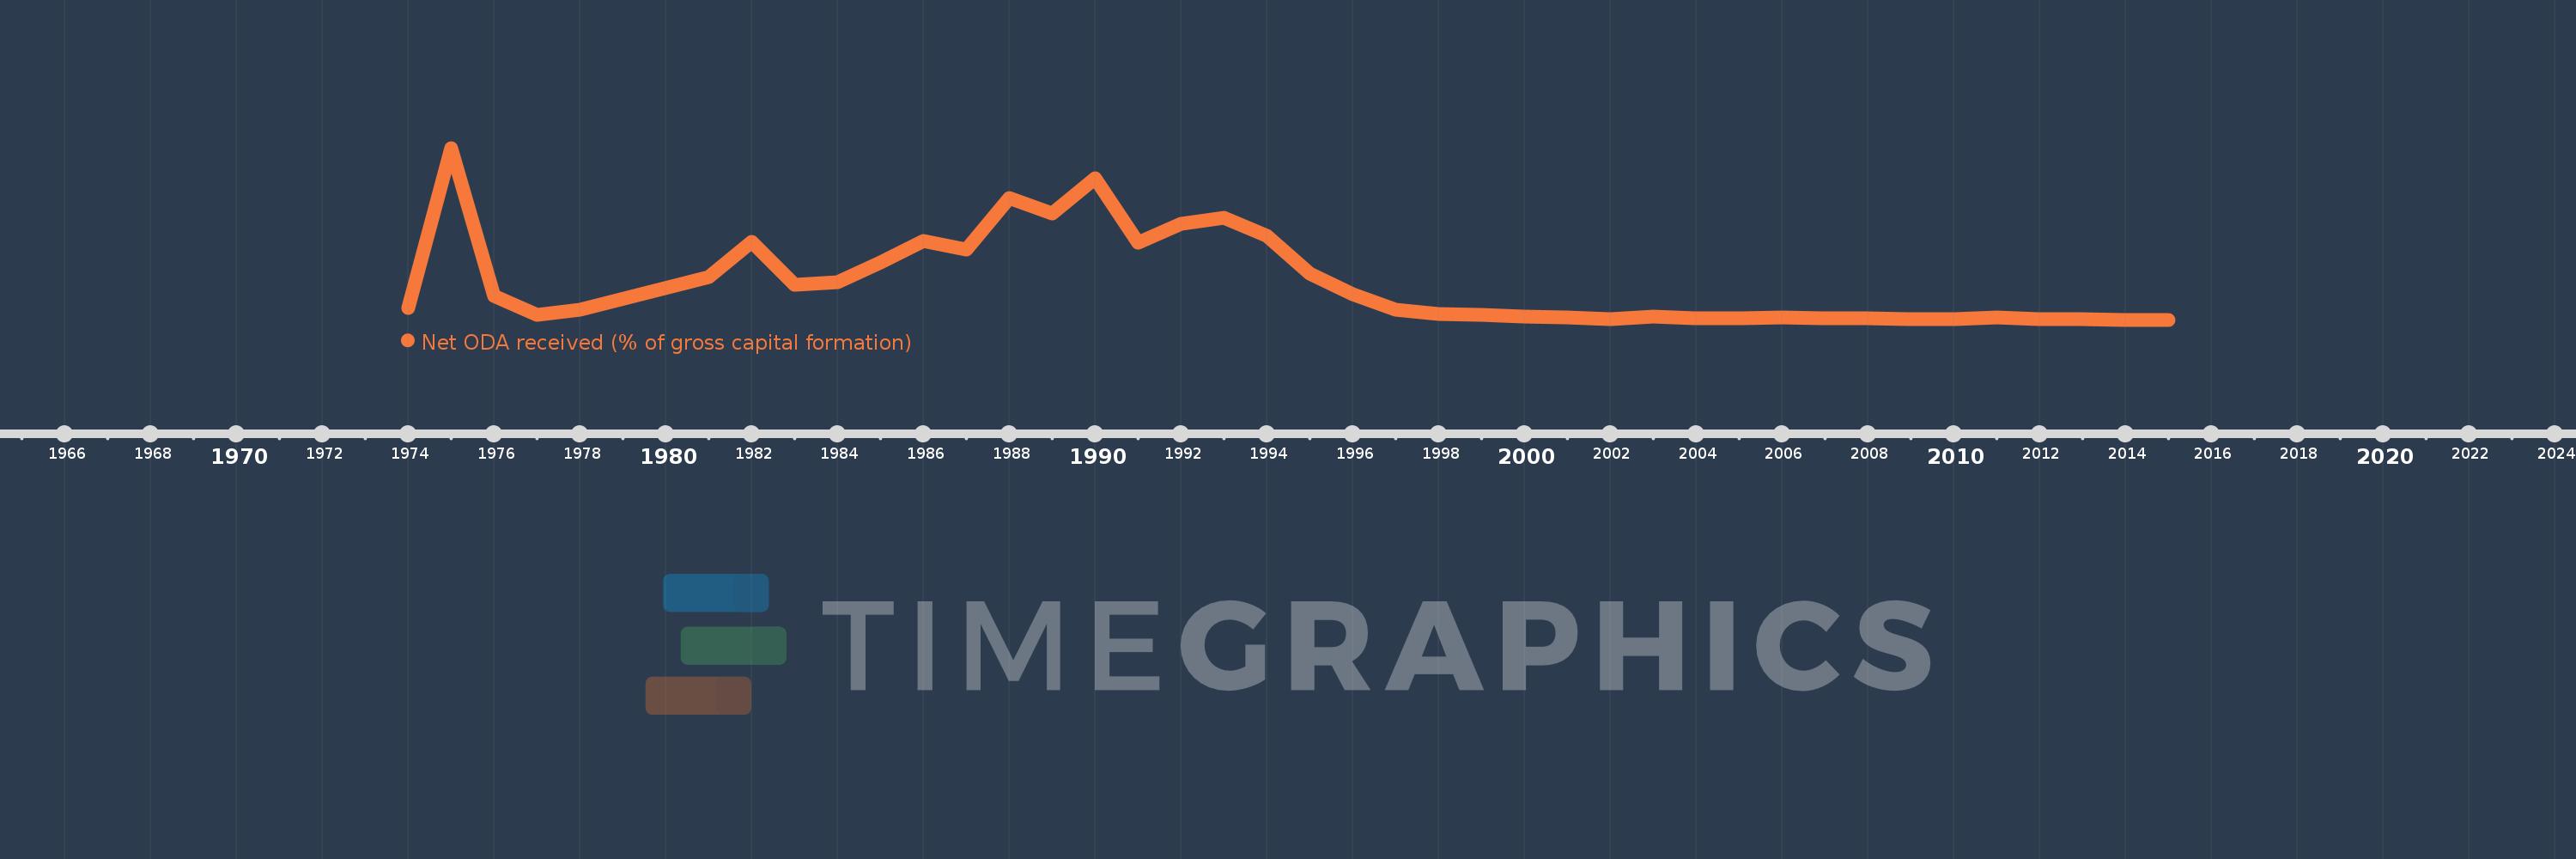
Net ODA received (% of gross capital formation)
2015,2014,2013,2012,2011,2010,2009,2008,2007,2006,2005,2004,2003,2002,2001,2000,1999,1998,1997,1996,1995,1994,1993,1992,1991,1990,1989,1988,1987,1986,1985,1984,1983,1982,1981,1978,1977,1976,1975,1974
This statistics in other country:
AfghanistanAlbaniaAlgeriaAngolaAntigua and BarbudaArab WorldArgentinaArmeniaArubaAzerbaijanBahamas, TheBahrainBangladeshBarbadosBelarusBelizeBeninBhutanBoliviaBosnia and HerzegovinaBotswanaBrazilBrunei DarussalamBurkina FasoBurundiCabo VerdeCambodiaCameroonCaribbean small statesCentral African RepublicCentral Europe and the BalticsChadChileChinaColombiaComorosCongo, Dem. Rep.Congo, Rep.Costa RicaCote d'IvoireCroatiaCubaCyprusDjiboutiDominicaDominican RepublicEast Asia & PacificEast Asia & Pacific (excluding high income)East Asia & Pacific (IDA & IBRD countries)EcuadorEgypt, Arab Rep.El SalvadorEquatorial GuineaEritreaEthiopiaEuro areaEurope & Central AsiaEurope & Central Asia (excluding high income)Europe & Central Asia (IDA & IBRD countries)European UnionFijiFragile and conflict affected situationsGabonGambia, TheGeorgiaGhanaGrenadaGuatemalaGuineaGuinea-BissauGuyanaHaitiHeavily indebted poor countries (HIPC)High incomeHondurasHong Kong SAR, ChinaIBRD onlyIDA & IBRD totalIDA blendIDA onlyIDA totalIndiaIndonesiaIran, Islamic Rep.IraqIsraelJamaicaJordanKazakhstanKenyaKiribatiKorea, Rep.KosovoKuwaitKyrgyz RepublicLao PDRLatin America & Caribbean Latin America & Caribbean (excluding high income)Latin America & the Caribbean (IDA & IBRD countries)Least developed countries: UN classificationLebanonLesothoLiberiaLibyaLow & middle incomeLow incomeLower middle incomeMacao SAR, ChinaMacedonia, FYRMadagascarMalawiMalaysiaMaldivesMaliMaltaMauritaniaMauritiusMexicoMiddle East & North AfricaMiddle East & North Africa (excluding high income)Middle East & North Africa (IDA & IBRD countries)Middle incomeMoldovaMongoliaMontenegroMoroccoMozambiqueNamibiaNepalNew CaledoniaNicaraguaNigerNigeriaNorth AmericaOECD membersOmanOther small statesPakistanPanamaPapua New GuineaParaguayPeruPhilippinesQatarRwandaSaudi ArabiaSenegalSerbiaSeychellesSierra LeoneSingaporeSloveniaSmall statesSolomon IslandsSouth AfricaSouth AsiaSouth Asia (IDA & IBRD)South SudanSri LankaSt. Kitts and NevisSt. LuciaSt. Vincent and the GrenadinesSub-Saharan Africa Sub-Saharan Africa (excluding high income)Sub-Saharan Africa (IDA & IBRD countries)SudanSurinameSwazilandSyrian Arab RepublicTajikistanTanzaniaThailandTimor-LesteTogoTongaTrinidad and TobagoTunisiaTurkeyTurkmenistanUgandaUkraineUpper middle incomeUruguayUzbekistanVanuatuVenezuela, RBVietnamWest Bank and GazaWorldYemen, Rep.ZambiaZimbabwe Timeline:
This timeline shows a graph from 1974 to 2015 of Equatorial Guinea. No data until 1973. Number of actual observations by date: 40.
Source name:
World Development Indicators
Source organization:
Development Assistance Committee of the Organisation for Economic Co-operation and Development, Geographical Distribution of Financial Flows to Developing Countries, Development Co-operation Report, and International Development Statistics database. Data are available online at: www.oecd.org/dac/stats/idsonline. World Bank gross capital formation estimates are used for the denominator.
Categories, topics:
Aid Effectiveness
Last updated:
apr 23, 2017
Indicators value changes by year
Maximum:
101.455
jan 1, 1975
At the date of observation
Value
Absolute change
Change from previous value
jan 1, 1974
6.896
+6.896
0.0%
jan 1, 1975
101.455
+94.559
1.37K%
jan 1, 1976
13.952
-87.503
-86.25%
jan 1, 1977
3.077
-10.875
-77.95%
jan 1, 1978
5.989
+2.912
94.64%
jan 1, 1981
25.16
+19.171
320.1%
jan 1, 1982
46.167
+21.007
83.49%
jan 1, 1983
20.539
-25.628
-55.51%
jan 1, 1984
22.406
+1.867
9.09%
jan 1, 1985
33.707
+11.301
50.44%
jan 1, 1986
46.774
+13.067
38.77%
jan 1, 1987
41.537
-5.237
-11.2%
jan 1, 1988
71.897
+30.36
73.09%
jan 1, 1989
63.001
-8.896
-12.37%
jan 1, 1990
83.579
+20.578
32.66%
jan 1, 1991
45.579
-38.0
-45.47%
jan 1, 1992
56.61
+11.032
24.2%
jan 1, 1993
60.37
+3.759
6.64%
jan 1, 1994
49.584
-10.786
-17.87%
jan 1, 1995
27.146
-22.437
-45.25%
jan 1, 1996
14.855
-12.292
-45.28%
jan 1, 1997
6.052
-8.803
-59.26%
jan 1, 1998
3.627
-2.425
-40.07%
jan 1, 1999
2.718
-0.909
-25.07%
jan 1, 2000
2.099
-0.618
-22.76%
jan 1, 2001
1.552
-0.547
-26.08%
jan 1, 2002
0.613
-0.939
-60.51%
jan 1, 2003
2.003
+1.39
226.84%
jan 1, 2004
0.725
-1.278
-63.81%
jan 1, 2005
0.858
+0.133
18.41%
jan 1, 2006
1.175
+0.317
36.95%
jan 1, 2007
0.981
-0.195
-16.58%
jan 1, 2008
0.811
-0.17
-17.3%
jan 1, 2009
0.59
-0.221
-27.27%
jan 1, 2010
0.532
-0.058
-9.81%
jan 1, 2011
1.366
+0.834
156.74%
jan 1, 2012
0.355
-1.01
-73.97%
jan 1, 2013
0.154
-0.201
-56.64%
jan 1, 2014
0.065
-0.089
-57.66%
jan 1, 2015
0.009
-0.056
-86.22%
Ranking of countries by current statistics by years


Comments: