29
/
en
AIzaSyAYiBZKx7MnpbEhh9jyipgxe19OcubqV5w
April 1, 2024
167886
Kenya
KEN
true
2
1
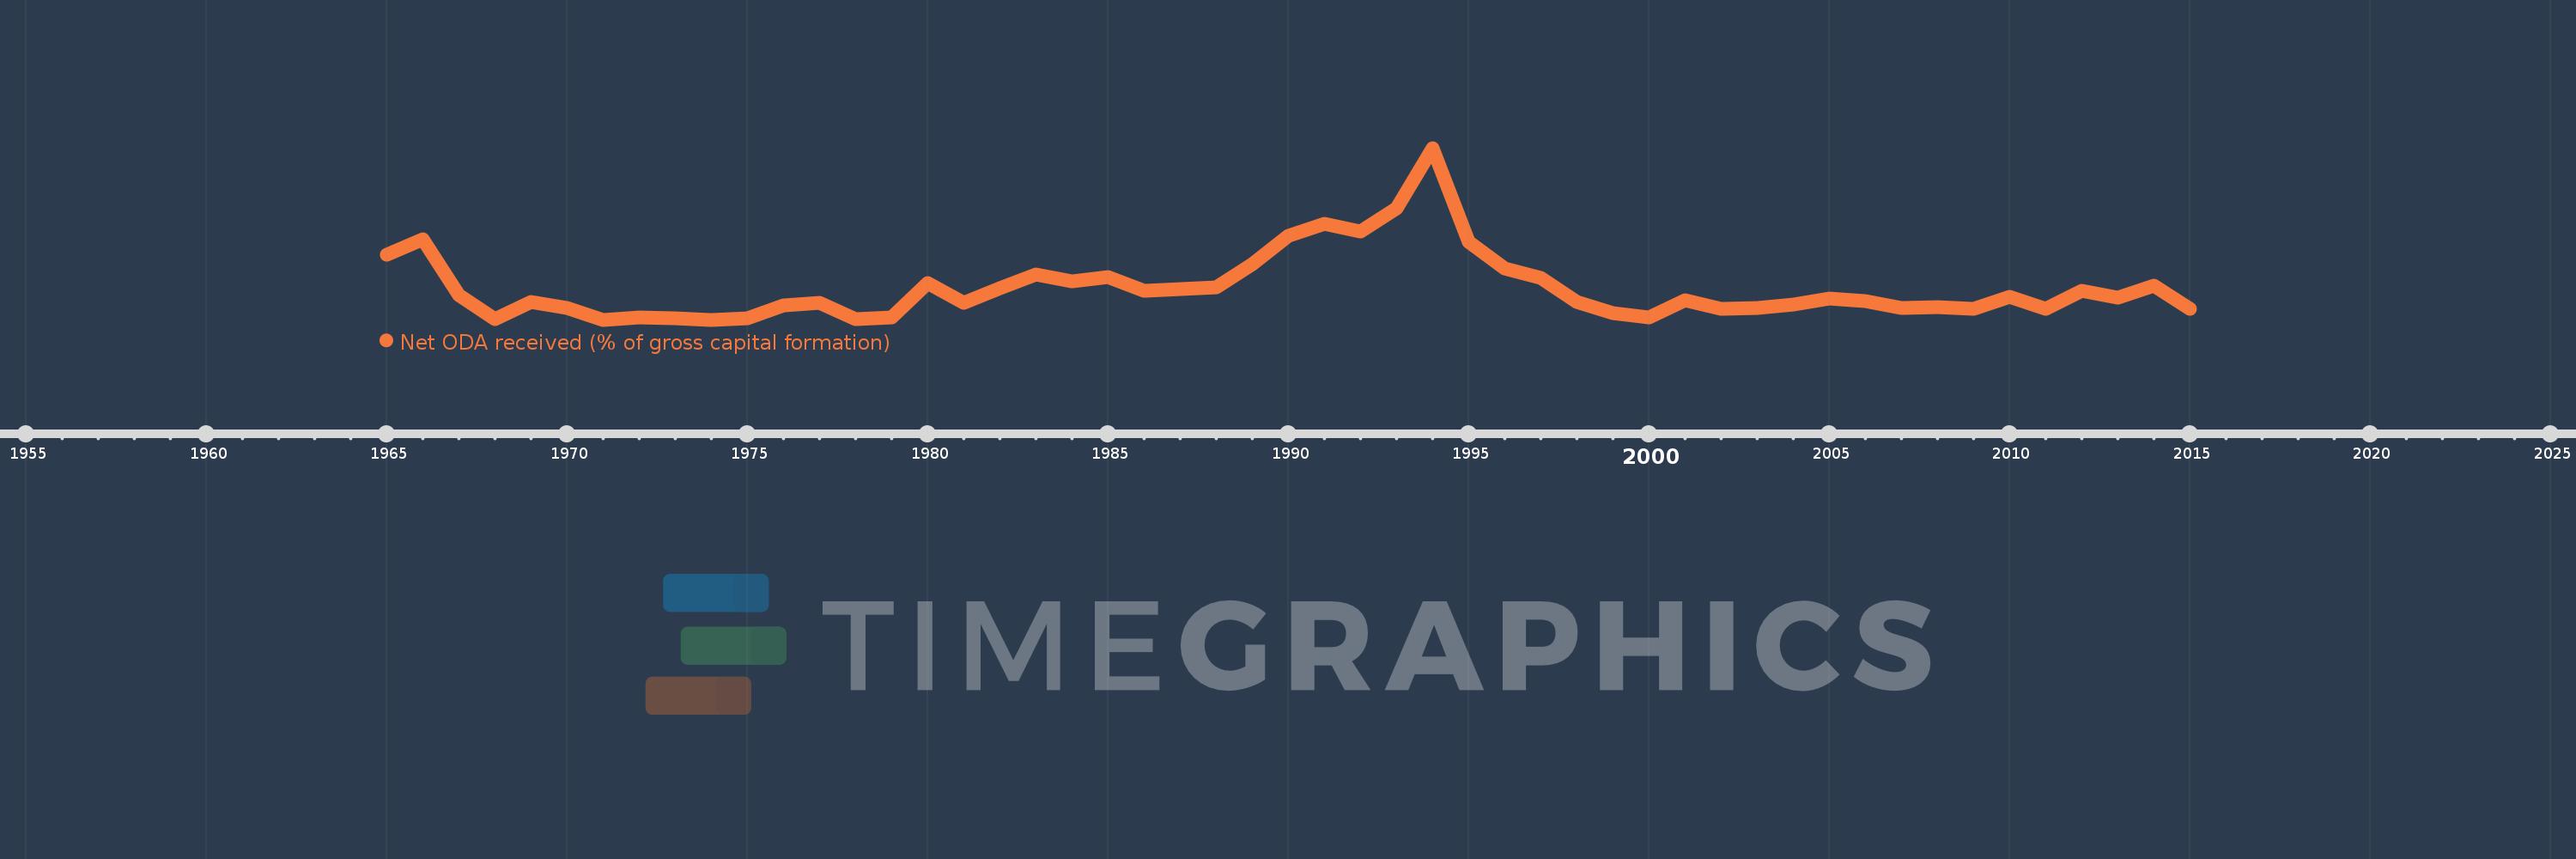
Net ODA received (% of gross capital formation)
2015,2014,2013,2012,2011,2010,2009,2008,2007,2006,2005,2004,2003,2002,2001,2000,1999,1998,1997,1996,1995,1994,1993,1992,1991,1990,1989,1988,1987,1986,1985,1984,1983,1982,1981,1980,1979,1978,1977,1976,1975,1974,1973,1972,1971,1970,1969,1968,1967,1966,1965
This statistics in other country:
AfghanistanAlbaniaAlgeriaAngolaAntigua and BarbudaArab WorldArgentinaArmeniaArubaAzerbaijanBahamas, TheBahrainBangladeshBarbadosBelarusBelizeBeninBhutanBoliviaBosnia and HerzegovinaBotswanaBrazilBrunei DarussalamBurkina FasoBurundiCabo VerdeCambodiaCameroonCaribbean small statesCentral African RepublicCentral Europe and the BalticsChadChileChinaColombiaComorosCongo, Dem. Rep.Congo, Rep.Costa RicaCote d'IvoireCroatiaCubaCyprusDjiboutiDominicaDominican RepublicEast Asia & PacificEast Asia & Pacific (excluding high income)East Asia & Pacific (IDA & IBRD countries)EcuadorEgypt, Arab Rep.El SalvadorEquatorial GuineaEritreaEthiopiaEuro areaEurope & Central AsiaEurope & Central Asia (excluding high income)Europe & Central Asia (IDA & IBRD countries)European UnionFijiFragile and conflict affected situationsGabonGambia, TheGeorgiaGhanaGrenadaGuatemalaGuineaGuinea-BissauGuyanaHaitiHeavily indebted poor countries (HIPC)High incomeHondurasHong Kong SAR, ChinaIBRD onlyIDA & IBRD totalIDA blendIDA onlyIDA totalIndiaIndonesiaIran, Islamic Rep.IraqIsraelJamaicaJordanKazakhstanKenyaKiribatiKorea, Rep.KosovoKuwaitKyrgyz RepublicLao PDRLatin America & Caribbean Latin America & Caribbean (excluding high income)Latin America & the Caribbean (IDA & IBRD countries)Least developed countries: UN classificationLebanonLesothoLiberiaLibyaLow & middle incomeLow incomeLower middle incomeMacao SAR, ChinaMacedonia, FYRMadagascarMalawiMalaysiaMaldivesMaliMaltaMauritaniaMauritiusMexicoMiddle East & North AfricaMiddle East & North Africa (excluding high income)Middle East & North Africa (IDA & IBRD countries)Middle incomeMoldovaMongoliaMontenegroMoroccoMozambiqueNamibiaNepalNew CaledoniaNicaraguaNigerNigeriaNorth AmericaOECD membersOmanOther small statesPakistanPanamaPapua New GuineaParaguayPeruPhilippinesQatarRwandaSaudi ArabiaSenegalSerbiaSeychellesSierra LeoneSingaporeSloveniaSmall statesSolomon IslandsSouth AfricaSouth AsiaSouth Asia (IDA & IBRD)South SudanSri LankaSt. Kitts and NevisSt. LuciaSt. Vincent and the GrenadinesSub-Saharan Africa Sub-Saharan Africa (excluding high income)Sub-Saharan Africa (IDA & IBRD countries)SudanSurinameSwazilandSyrian Arab RepublicTajikistanTanzaniaThailandTimor-LesteTogoTongaTrinidad and TobagoTunisiaTurkeyTurkmenistanUgandaUkraineUpper middle incomeUruguayUzbekistanVanuatuVenezuela, RBVietnamWest Bank and GazaWorldYemen, Rep.ZambiaZimbabwe Timeline:
This timeline shows a graph from 1965 to 2015 of Kenya. No data until 1964. Number of actual observations by date: 51.
Source name:
World Development Indicators
Source organization:
Development Assistance Committee of the Organisation for Economic Co-operation and Development, Geographical Distribution of Financial Flows to Developing Countries, Development Co-operation Report, and International Development Statistics database. Data are available online at: www.oecd.org/dac/stats/idsonline. World Bank gross capital formation estimates are used for the denominator.
Categories, topics:
Aid Effectiveness
Last updated:
apr 23, 2017
Indicators value changes by year
Maximum:
90.273
jan 1, 1994
At the date of observation
Value
Absolute change
Change from previous value
jan 1, 1965
43.463
+43.463
0.0%
jan 1, 1966
50.216
+6.753
15.54%
jan 1, 1967
25.568
-24.648
-49.08%
jan 1, 1968
14.764
-10.803
-42.25%
jan 1, 1969
22.376
+7.611
51.55%
jan 1, 1970
19.754
-2.621
-11.72%
jan 1, 1971
14.66
-5.094
-25.79%
jan 1, 1972
15.718
+1.057
7.21%
jan 1, 1973
15.28
-0.438
-2.78%
jan 1, 1974
14.705
-0.575
-3.76%
jan 1, 1975
15.223
+0.518
3.53%
jan 1, 1976
21.112
+5.888
38.68%
jan 1, 1977
21.979
+0.868
4.11%
jan 1, 1978
15.078
-6.902
-31.4%
jan 1, 1979
15.545
+0.468
3.1%
jan 1, 1980
30.814
+15.268
98.22%
jan 1, 1981
22.173
-8.641
-28.04%
jan 1, 1982
28.534
+6.361
28.69%
jan 1, 1983
34.468
+5.934
20.8%
jan 1, 1984
31.659
-2.809
-8.15%
jan 1, 1985
33.298
+1.639
5.18%
jan 1, 1986
27.461
-5.837
-17.53%
jan 1, 1987
28.11
+0.649
2.36%
jan 1, 1988
28.781
+0.671
2.39%
jan 1, 1989
39.129
+10.348
35.95%
jan 1, 1990
51.458
+12.329
31.51%
jan 1, 1991
57.028
+5.57
10.82%
jan 1, 1992
53.613
-3.415
-5.99%
jan 1, 1993
63.579
+9.966
18.59%
jan 1, 1994
90.273
+26.695
41.99%
jan 1, 1995
49.063
-41.21
-45.65%
jan 1, 1996
37.077
-11.986
-24.43%
jan 1, 1997
32.922
-4.154
-11.2%
jan 1, 1998
22.59
-10.333
-31.38%
jan 1, 1999
17.648
-4.941
-21.87%
jan 1, 2000
15.511
-2.138
-12.11%
jan 1, 2001
23.174
+7.663
49.4%
jan 1, 2002
19.312
-3.862
-16.66%
jan 1, 2003
19.736
+0.424
2.2%
jan 1, 2004
21.29
+1.554
7.87%
jan 1, 2005
24.183
+2.893
13.59%
jan 1, 2006
22.956
-1.227
-5.07%
jan 1, 2007
19.673
-3.283
-14.3%
jan 1, 2008
20.294
+0.622
3.16%
jan 1, 2009
19.403
-0.892
-4.39%
jan 1, 2010
24.817
+5.414
27.9%
jan 1, 2011
19.589
-5.228
-21.07%
jan 1, 2012
27.244
+7.656
39.08%
jan 1, 2013
24.432
-2.813
-10.32%
jan 1, 2014
29.804
+5.372
21.99%
jan 1, 2015
19.298
-10.506
-35.25%
Ranking of countries by current statistics by years


Comments: