29
/
en
AIzaSyAYiBZKx7MnpbEhh9jyipgxe19OcubqV5w
April 1, 2024
253385
Sudan
SDN
true
2
1
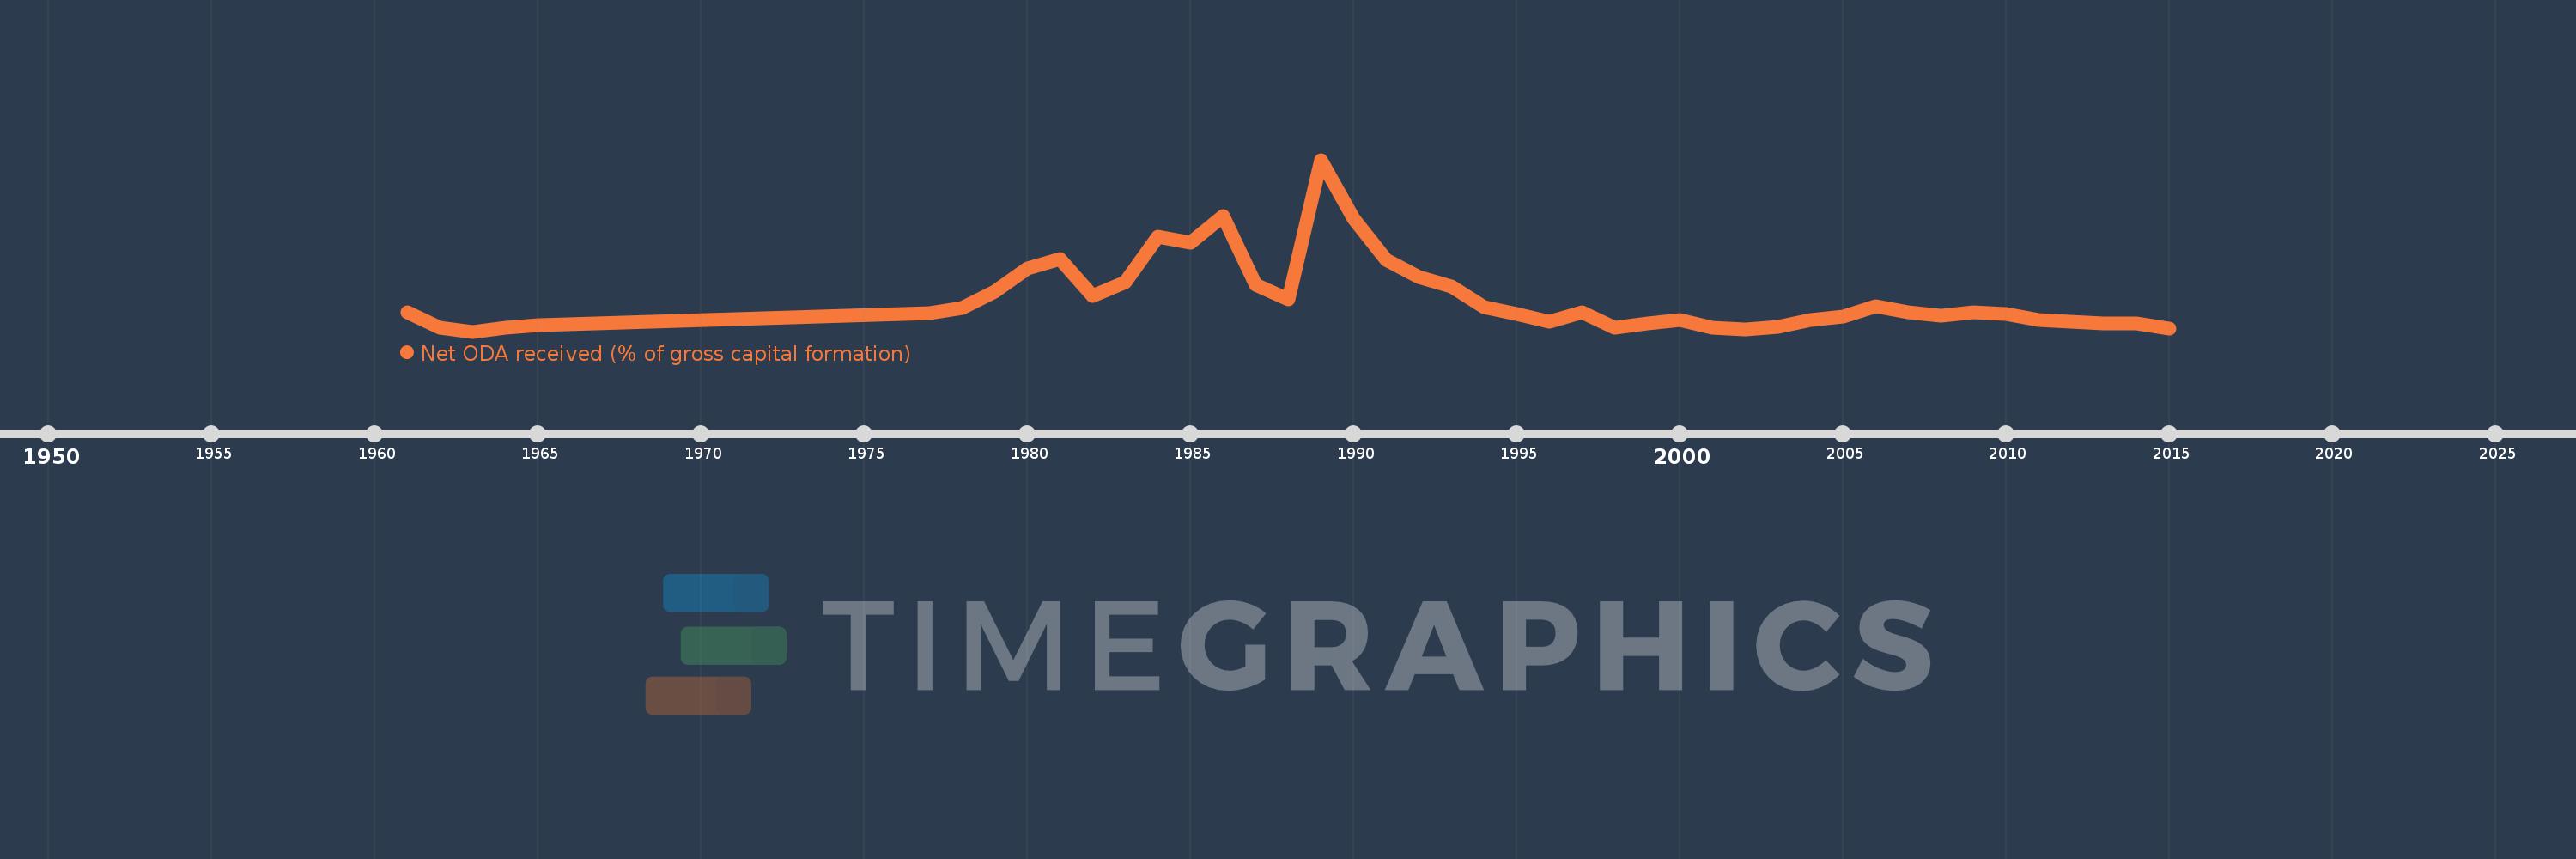
Net ODA received (% of gross capital formation)
2015,2014,2013,2012,2011,2010,2009,2008,2007,2006,2005,2004,2003,2002,2001,2000,1999,1998,1997,1996,1995,1994,1993,1992,1991,1990,1989,1988,1987,1986,1985,1984,1983,1982,1981,1980,1979,1978,1977,1965,1964,1963,1962,1961
This statistics in other country:
AfghanistanAlbaniaAlgeriaAngolaAntigua and BarbudaArab WorldArgentinaArmeniaArubaAzerbaijanBahamas, TheBahrainBangladeshBarbadosBelarusBelizeBeninBhutanBoliviaBosnia and HerzegovinaBotswanaBrazilBrunei DarussalamBurkina FasoBurundiCabo VerdeCambodiaCameroonCaribbean small statesCentral African RepublicCentral Europe and the BalticsChadChileChinaColombiaComorosCongo, Dem. Rep.Congo, Rep.Costa RicaCote d'IvoireCroatiaCubaCyprusDjiboutiDominicaDominican RepublicEast Asia & PacificEast Asia & Pacific (excluding high income)East Asia & Pacific (IDA & IBRD countries)EcuadorEgypt, Arab Rep.El SalvadorEquatorial GuineaEritreaEthiopiaEuro areaEurope & Central AsiaEurope & Central Asia (excluding high income)Europe & Central Asia (IDA & IBRD countries)European UnionFijiFragile and conflict affected situationsGabonGambia, TheGeorgiaGhanaGrenadaGuatemalaGuineaGuinea-BissauGuyanaHaitiHeavily indebted poor countries (HIPC)High incomeHondurasHong Kong SAR, ChinaIBRD onlyIDA & IBRD totalIDA blendIDA onlyIDA totalIndiaIndonesiaIran, Islamic Rep.IraqIsraelJamaicaJordanKazakhstanKenyaKiribatiKorea, Rep.KosovoKuwaitKyrgyz RepublicLao PDRLatin America & Caribbean Latin America & Caribbean (excluding high income)Latin America & the Caribbean (IDA & IBRD countries)Least developed countries: UN classificationLebanonLesothoLiberiaLibyaLow & middle incomeLow incomeLower middle incomeMacao SAR, ChinaMacedonia, FYRMadagascarMalawiMalaysiaMaldivesMaliMaltaMauritaniaMauritiusMexicoMiddle East & North AfricaMiddle East & North Africa (excluding high income)Middle East & North Africa (IDA & IBRD countries)Middle incomeMoldovaMongoliaMontenegroMoroccoMozambiqueNamibiaNepalNew CaledoniaNicaraguaNigerNigeriaNorth AmericaOECD membersOmanOther small statesPakistanPanamaPapua New GuineaParaguayPeruPhilippinesQatarRwandaSaudi ArabiaSenegalSerbiaSeychellesSierra LeoneSingaporeSloveniaSmall statesSolomon IslandsSouth AfricaSouth AsiaSouth Asia (IDA & IBRD)South SudanSri LankaSt. Kitts and NevisSt. LuciaSt. Vincent and the GrenadinesSub-Saharan Africa Sub-Saharan Africa (excluding high income)Sub-Saharan Africa (IDA & IBRD countries)SudanSurinameSwazilandSyrian Arab RepublicTajikistanTanzaniaThailandTimor-LesteTogoTongaTrinidad and TobagoTunisiaTurkeyTurkmenistanUgandaUkraineUpper middle incomeUruguayUzbekistanVanuatuVenezuela, RBVietnamWest Bank and GazaWorldYemen, Rep.ZambiaZimbabwe Timeline:
This timeline shows a graph from 1961 to 2015 of Sudan. No data until 1960. Number of actual observations by date: 44.
Source name:
World Development Indicators
Source organization:
Development Assistance Committee of the Organisation for Economic Co-operation and Development, Geographical Distribution of Financial Flows to Developing Countries, Development Co-operation Report, and International Development Statistics database. Data are available online at: www.oecd.org/dac/stats/idsonline. World Bank gross capital formation estimates are used for the denominator.
Categories, topics:
Aid Effectiveness
Last updated:
apr 23, 2017
Indicators value changes by year
Maximum:
139.571
jan 1, 1989
At the date of observation
Value
Absolute change
Change from previous value
jan 1, 1961
19.754
+19.754
0.0%
jan 1, 1962
6.947
-12.807
-64.83%
jan 1, 1963
4.226
-2.721
-39.17%
jan 1, 1964
7.248
+3.022
71.5%
jan 1, 1965
9.349
+2.102
29.0%
jan 1, 1977
19.037
+9.687
103.62%
jan 1, 1978
22.539
+3.503
18.4%
jan 1, 1979
35.78
+13.241
58.75%
jan 1, 1980
53.969
+18.189
50.83%
jan 1, 1981
61.448
+7.479
13.86%
jan 1, 1982
32.645
-28.803
-46.87%
jan 1, 1983
43.027
+10.382
31.8%
jan 1, 1984
78.855
+35.828
83.27%
jan 1, 1985
74.195
-4.66
-5.91%
jan 1, 1986
95.525
+21.33
28.75%
jan 1, 1987
41.252
-54.273
-56.82%
jan 1, 1988
29.284
-11.967
-29.01%
jan 1, 1989
139.571
+110.286
376.6%
jan 1, 1990
93.482
-46.089
-33.02%
jan 1, 1991
61.053
-32.429
-34.69%
jan 1, 1992
47.297
-13.756
-22.53%
jan 1, 1993
40.028
-7.269
-15.37%
jan 1, 1994
23.214
-16.814
-42.0%
jan 1, 1995
18.337
-4.877
-21.01%
jan 1, 1996
12.135
-6.202
-33.82%
jan 1, 1997
19.354
+7.219
59.49%
jan 1, 1998
7.52
-11.833
-61.14%
jan 1, 1999
10.442
+2.921
38.85%
jan 1, 2000
13.683
+3.242
31.04%
jan 1, 2001
7.364
-6.319
-46.18%
jan 1, 2002
5.952
-1.412
-19.18%
jan 1, 2003
7.794
+1.842
30.95%
jan 1, 2004
13.162
+5.367
68.87%
jan 1, 2005
15.807
+2.645
20.1%
jan 1, 2006
24.471
+8.665
54.82%
jan 1, 2007
19.771
-4.701
-19.21%
jan 1, 2008
16.745
-3.026
-15.31%
jan 1, 2009
19.152
+2.408
14.38%
jan 1, 2010
18.057
-1.096
-5.72%
jan 1, 2011
13.409
-4.648
-25.74%
jan 1, 2012
11.984
-1.425
-10.63%
jan 1, 2013
10.476
-1.508
-12.58%
jan 1, 2014
10.677
+0.201
1.92%
jan 1, 2015
6.456
-4.222
-39.54%
Ranking of countries by current statistics by years


Comments: