29
/
en
AIzaSyAYiBZKx7MnpbEhh9jyipgxe19OcubqV5w
April 1, 2024
185580
Madagascar
MDG
true
2
1
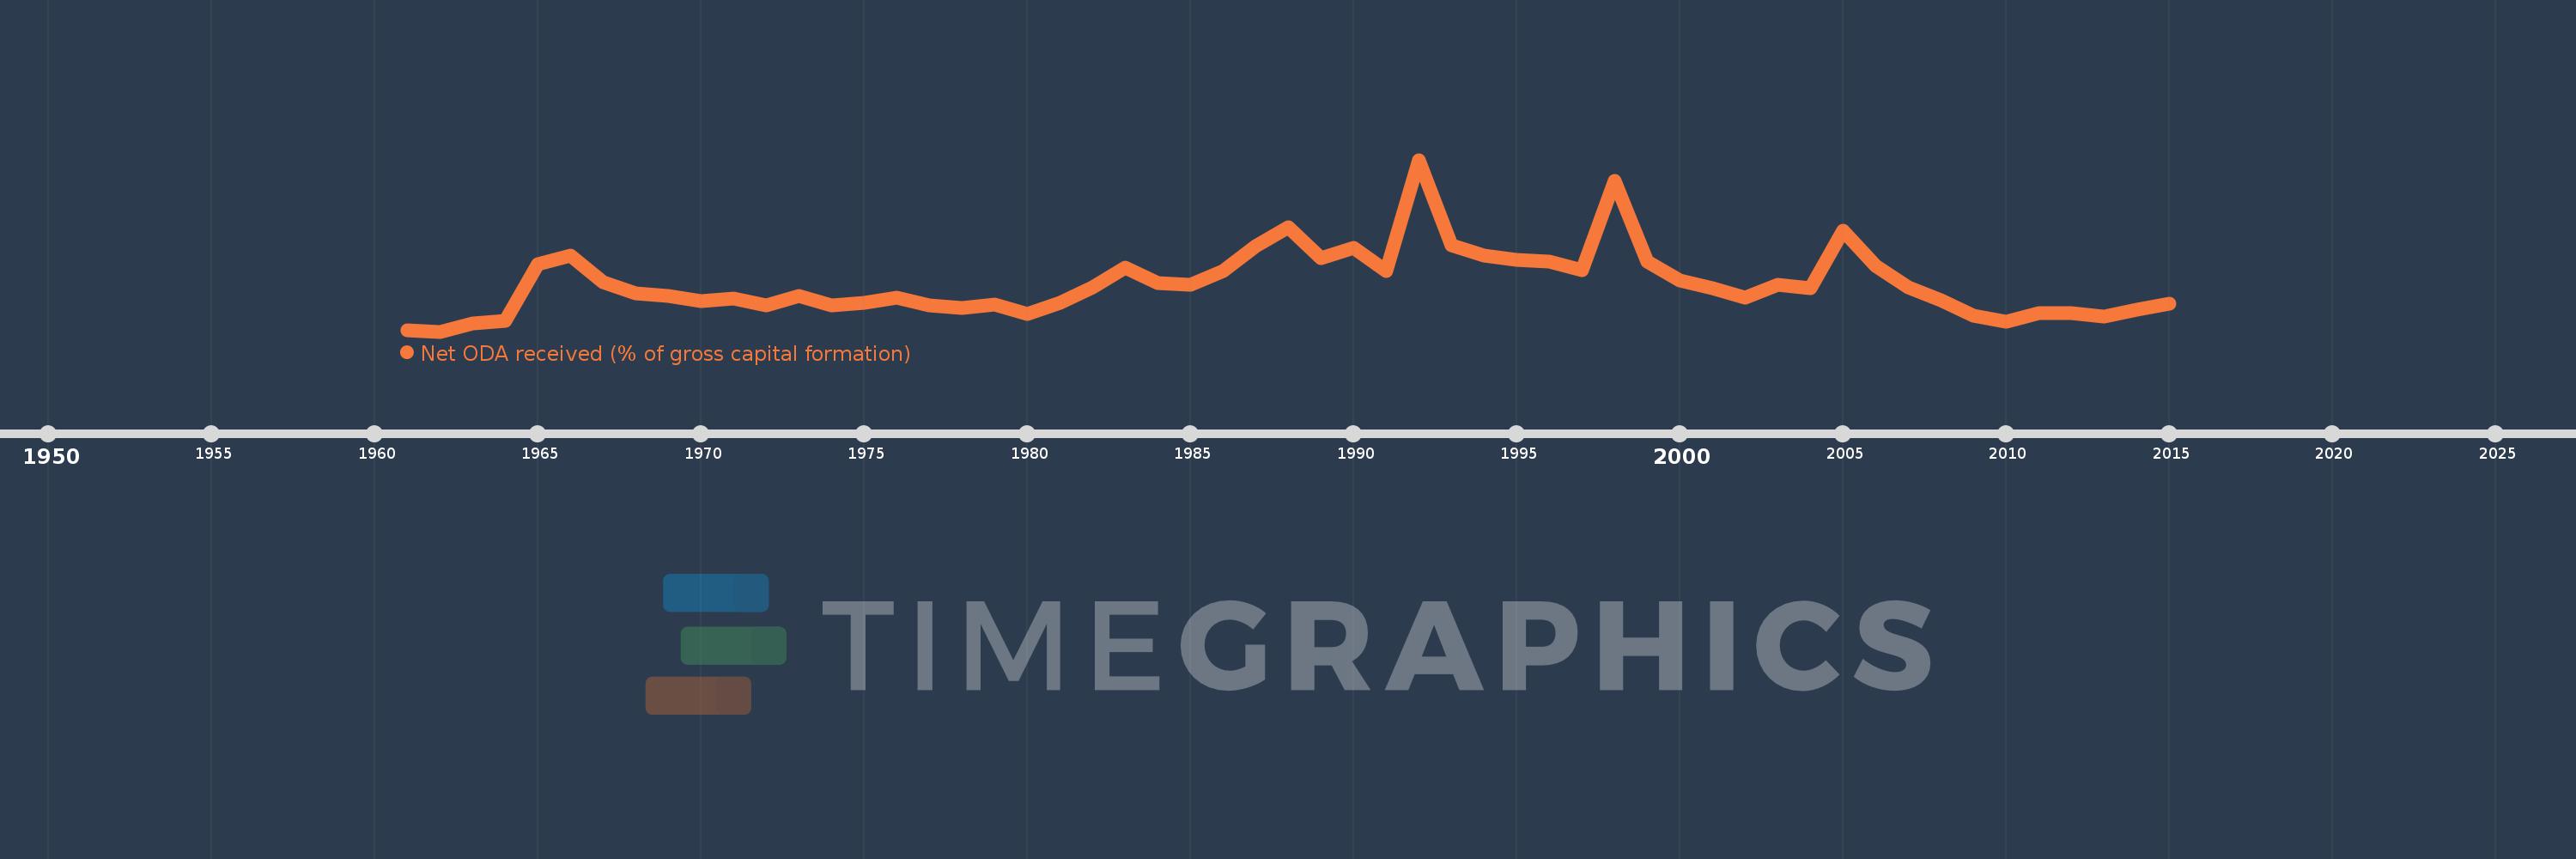
Net ODA received (% of gross capital formation)
2015,2014,2013,2012,2011,2010,2009,2008,2007,2006,2005,2004,2003,2002,2001,2000,1999,1998,1997,1996,1995,1994,1993,1992,1991,1990,1989,1988,1987,1986,1985,1984,1983,1982,1981,1980,1979,1978,1977,1976,1975,1974,1973,1972,1971,1970,1969,1968,1967,1966,1965,1964,1963,1962,1961
This statistics in other country:
AfghanistanAlbaniaAlgeriaAngolaAntigua and BarbudaArab WorldArgentinaArmeniaArubaAzerbaijanBahamas, TheBahrainBangladeshBarbadosBelarusBelizeBeninBhutanBoliviaBosnia and HerzegovinaBotswanaBrazilBrunei DarussalamBurkina FasoBurundiCabo VerdeCambodiaCameroonCaribbean small statesCentral African RepublicCentral Europe and the BalticsChadChileChinaColombiaComorosCongo, Dem. Rep.Congo, Rep.Costa RicaCote d'IvoireCroatiaCubaCyprusDjiboutiDominicaDominican RepublicEast Asia & PacificEast Asia & Pacific (excluding high income)East Asia & Pacific (IDA & IBRD countries)EcuadorEgypt, Arab Rep.El SalvadorEquatorial GuineaEritreaEthiopiaEuro areaEurope & Central AsiaEurope & Central Asia (excluding high income)Europe & Central Asia (IDA & IBRD countries)European UnionFijiFragile and conflict affected situationsGabonGambia, TheGeorgiaGhanaGrenadaGuatemalaGuineaGuinea-BissauGuyanaHaitiHeavily indebted poor countries (HIPC)High incomeHondurasHong Kong SAR, ChinaIBRD onlyIDA & IBRD totalIDA blendIDA onlyIDA totalIndiaIndonesiaIran, Islamic Rep.IraqIsraelJamaicaJordanKazakhstanKenyaKiribatiKorea, Rep.KosovoKuwaitKyrgyz RepublicLao PDRLatin America & Caribbean Latin America & Caribbean (excluding high income)Latin America & the Caribbean (IDA & IBRD countries)Least developed countries: UN classificationLebanonLesothoLiberiaLibyaLow & middle incomeLow incomeLower middle incomeMacao SAR, ChinaMacedonia, FYRMadagascarMalawiMalaysiaMaldivesMaliMaltaMauritaniaMauritiusMexicoMiddle East & North AfricaMiddle East & North Africa (excluding high income)Middle East & North Africa (IDA & IBRD countries)Middle incomeMoldovaMongoliaMontenegroMoroccoMozambiqueNamibiaNepalNew CaledoniaNicaraguaNigerNigeriaNorth AmericaOECD membersOmanOther small statesPakistanPanamaPapua New GuineaParaguayPeruPhilippinesQatarRwandaSaudi ArabiaSenegalSerbiaSeychellesSierra LeoneSingaporeSloveniaSmall statesSolomon IslandsSouth AfricaSouth AsiaSouth Asia (IDA & IBRD)South SudanSri LankaSt. Kitts and NevisSt. LuciaSt. Vincent and the GrenadinesSub-Saharan Africa Sub-Saharan Africa (excluding high income)Sub-Saharan Africa (IDA & IBRD countries)SudanSurinameSwazilandSyrian Arab RepublicTajikistanTanzaniaThailandTimor-LesteTogoTongaTrinidad and TobagoTunisiaTurkeyTurkmenistanUgandaUkraineUpper middle incomeUruguayUzbekistanVanuatuVenezuela, RBVietnamWest Bank and GazaWorldYemen, Rep.ZambiaZimbabwe Timeline:
This timeline shows a graph from 1961 to 2015 of Madagascar. No data until 1960. Number of actual observations by date: 55.
Source name:
World Development Indicators
Source organization:
Development Assistance Committee of the Organisation for Economic Co-operation and Development, Geographical Distribution of Financial Flows to Developing Countries, Development Co-operation Report, and International Development Statistics database. Data are available online at: www.oecd.org/dac/stats/idsonline. World Bank gross capital formation estimates are used for the denominator.
Categories, topics:
Aid Effectiveness
Last updated:
apr 23, 2017
Indicators value changes by year
Maximum:
208.093
jan 1, 1992
At the date of observation
Value
Absolute change
Change from previous value
jan 1, 1961
5.656
+5.656
0.0%
jan 1, 1962
3.652
-2.004
-35.43%
jan 1, 1963
13.38
+9.728
266.39%
jan 1, 1964
16.154
+2.774
20.73%
jan 1, 1965
83.878
+67.724
419.24%
jan 1, 1966
93.786
+9.908
11.81%
jan 1, 1967
62.095
-31.692
-33.79%
jan 1, 1968
49.249
-12.846
-20.69%
jan 1, 1969
45.669
-3.58
-7.27%
jan 1, 1970
40.003
-5.666
-12.41%
jan 1, 1971
43.506
+3.502
8.76%
jan 1, 1972
34.835
-8.671
-19.93%
jan 1, 1973
46.229
+11.394
32.71%
jan 1, 1974
34.91
-11.318
-24.48%
jan 1, 1975
37.788
+2.877
8.24%
jan 1, 1976
44.252
+6.465
17.11%
jan 1, 1977
34.566
-9.686
-21.89%
jan 1, 1978
31.79
-2.775
-8.03%
jan 1, 1979
35.348
+3.558
11.19%
jan 1, 1980
24.593
-10.755
-30.43%
jan 1, 1981
37.955
+13.361
54.33%
jan 1, 1982
56.463
+18.508
48.76%
jan 1, 1983
80.248
+23.785
42.13%
jan 1, 1984
61.679
-18.569
-23.14%
jan 1, 1985
59.285
-2.393
-3.88%
jan 1, 1986
75.598
+16.313
27.52%
jan 1, 1987
105.19
+29.593
39.14%
jan 1, 1988
127.495
+22.305
21.2%
jan 1, 1989
91.15
-36.345
-28.51%
jan 1, 1990
103.813
+12.663
13.89%
jan 1, 1991
75.903
-27.91
-26.89%
jan 1, 1992
208.093
+132.191
174.16%
jan 1, 1993
106.651
-101.442
-48.75%
jan 1, 1994
93.609
-13.042
-12.23%
jan 1, 1995
88.77
-4.839
-5.17%
jan 1, 1996
86.592
-2.178
-2.45%
jan 1, 1997
76.294
-10.299
-11.89%
jan 1, 1998
183.337
+107.043
140.3%
jan 1, 1999
86.947
-96.389
-52.58%
jan 1, 2000
64.561
-22.386
-25.75%
jan 1, 2001
54.886
-9.675
-14.99%
jan 1, 2002
44.185
-10.701
-19.5%
jan 1, 2003
59.626
+15.441
34.95%
jan 1, 2004
55.778
-3.848
-6.45%
jan 1, 2005
123.771
+67.993
121.9%
jan 1, 2006
81.631
-42.14
-34.05%
jan 1, 2007
56.026
-25.605
-31.37%
jan 1, 2008
41.124
-14.902
-26.6%
jan 1, 2009
22.201
-18.923
-46.01%
jan 1, 2010
14.936
-7.265
-32.72%
jan 1, 2011
26.037
+11.101
74.32%
jan 1, 2012
25.517
-0.519
-1.99%
jan 1, 2013
21.824
-3.693
-14.47%
jan 1, 2014
30.175
+8.35
38.26%
jan 1, 2015
37.235
+7.061
23.4%
Ranking of countries by current statistics by years


Comments: