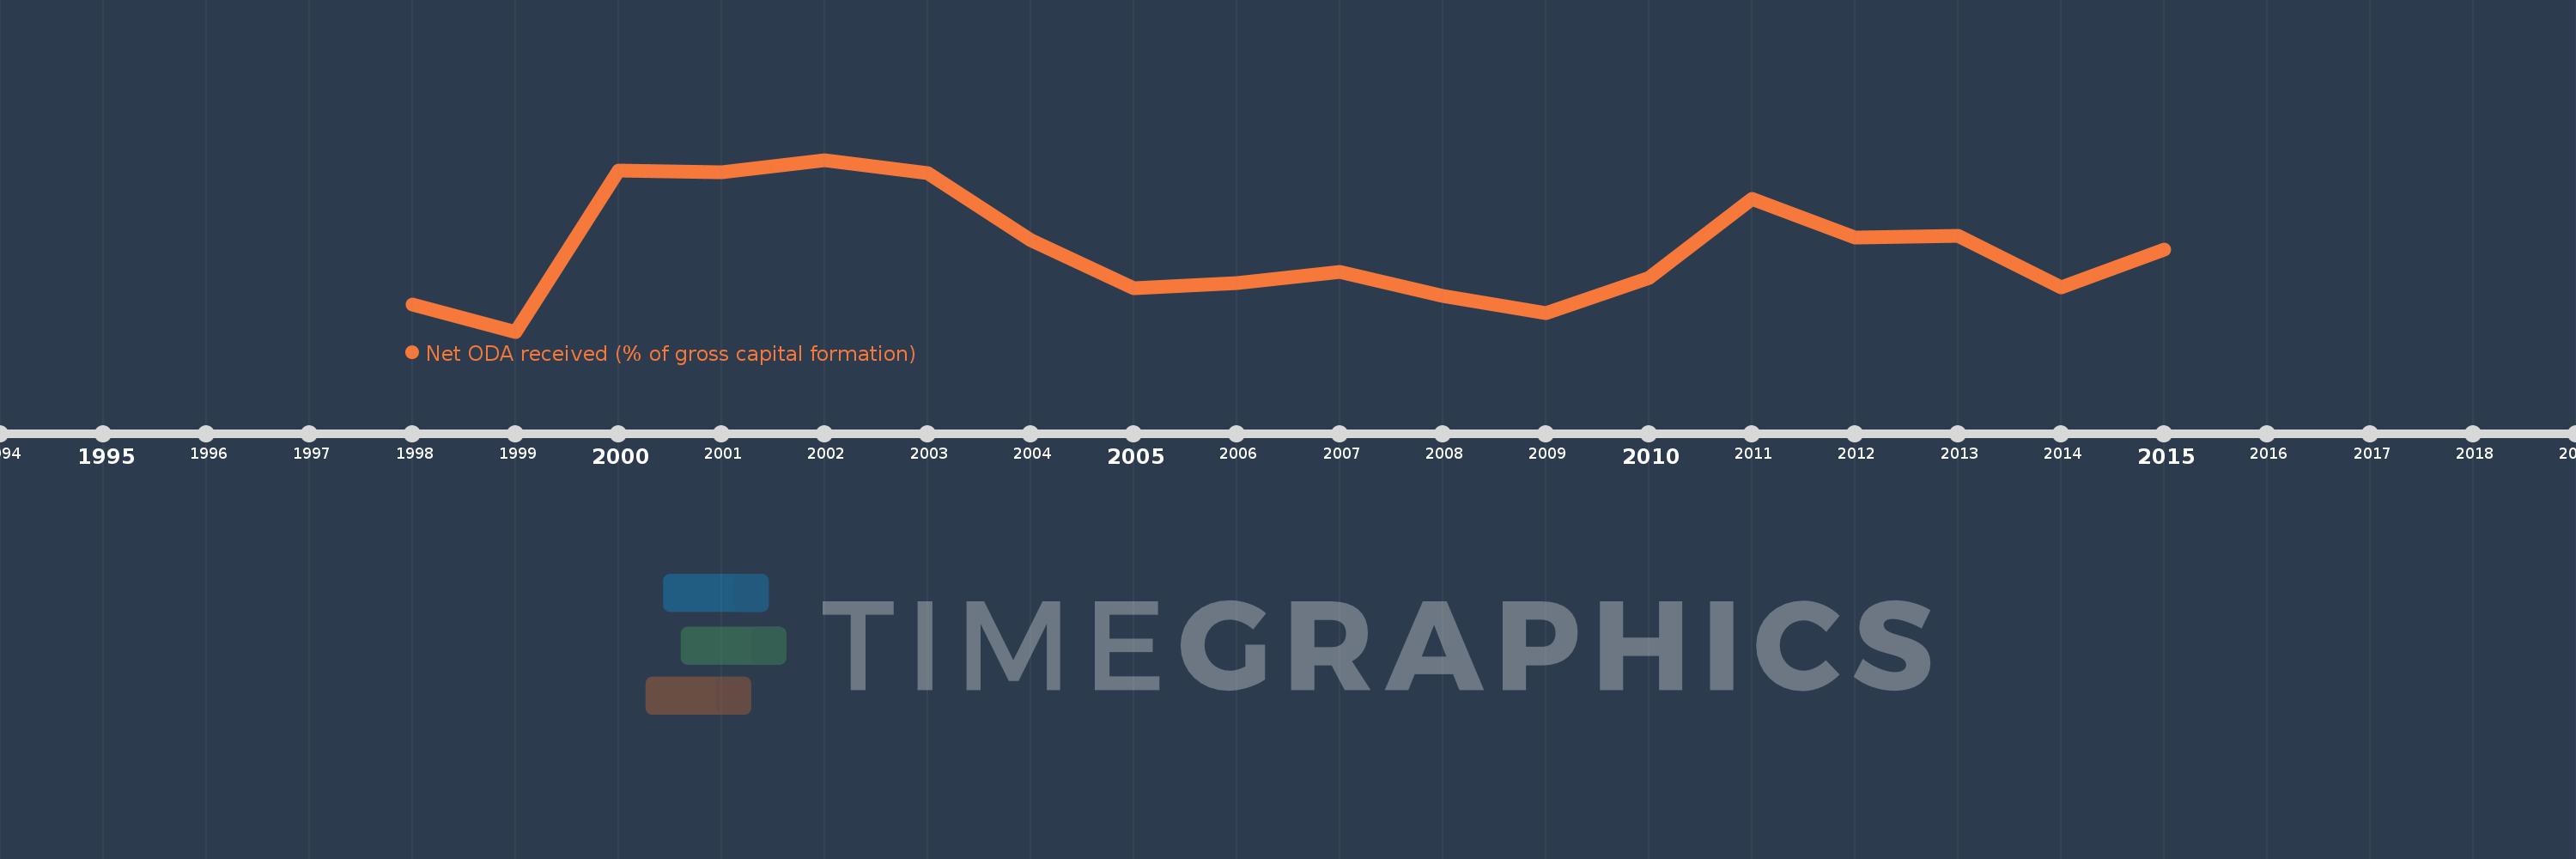
This timeline shows a graph from 1998 to 2015 of Moldova. No data until 1997. Number of actual observations by date: 18.
Source name:
World Development Indicators
Source organization:
Development Assistance Committee of the Organisation for Economic Co-operation and Development, Geographical Distribution of Financial Flows to Developing Countries, Development Co-operation Report, and International Development Statistics database. Data are available online at: www.oecd.org/dac/stats/idsonline. World Bank gross capital formation estimates are used for the denominator.
Categories, topics:
Aid Effectiveness
Last updated:
apr 23, 2017
Indicators value changes by year
Meaning:
24.834
Minimum:
9.019
jan 1, 1999
Maximum:
42.123
jan 1, 2002
At the date of observation
Value
Absolute change
Change from the previous value
jan 1, 1998
14.2
+14.2
0.0%
jan 1, 1999
9.019
-5.181
-36.49%
jan 1, 2000
39.978
+30.959
343.26%
jan 1, 2001
39.703
-0.274
-0.69%
jan 1, 2002
42.123
+2.42
6.09%
jan 1, 2003
39.619
-2.504
-5.94%
jan 1, 2004
26.639
-12.98
-32.76%
jan 1, 2005
17.304
-9.335
-35.04%
jan 1, 2006
18.358
+1.054
6.09%
jan 1, 2007
20.583
+2.225
12.12%
jan 1, 2008
15.878
-4.705
-22.86%
jan 1, 2009
12.554
-3.325
-20.94%
jan 1, 2010
19.355
+6.802
54.18%
jan 1, 2011
34.512
+15.157
78.31%
jan 1, 2012
27.2
-7.312
-21.19%
jan 1, 2013
27.488
+0.288
1.06%
jan 1, 2014
17.625
-9.863
-35.88%
jan 1, 2015
24.868
+7.243
41.1%
Ranking of countries by current statistics by years
